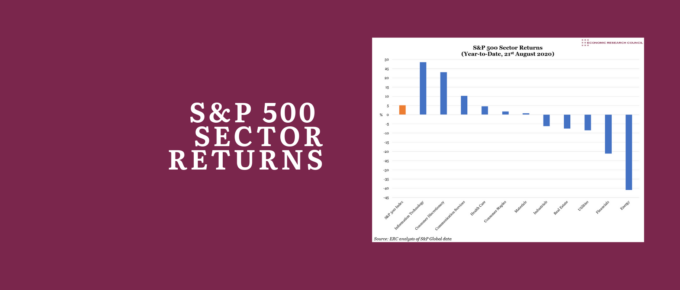
Investors have flocked to those sectors which they believe will benefit from lasting post-pandemic trends, and avoided those that have proven less resilient – with Information Technology up 29% at one extreme, and Energy down 41% at the other.
Chart of the Week
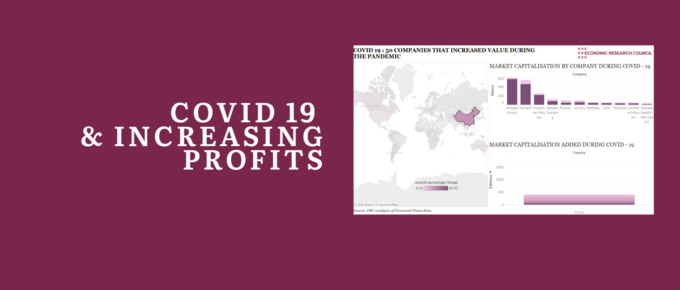
We invite you to explore the data, by clicking on each nation outlined in bold. You will then see companies headquartered in the country displayed on a graph showing the gains in their market capitalisation since the pandemic.
Chart of the Week
Given the importance of the industry to the UK economy, its ability to adapt to these challenges could have significant implications for employment and the pace of the economic recovery
Chart of the Week
All the indicators point toward a sweet and sour year for start-ups. While UK tech startups raised €5.3 billion in venture capital funding between January and May 2020, similar to in 2019, the optimism appears to be subsiding in the second half of the year.
Chart of the Week
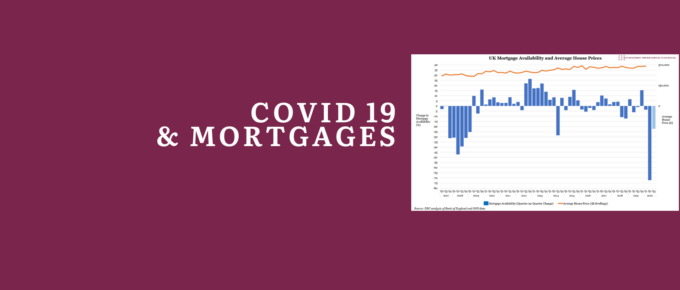
According to the Bank of England, the availability of mortgages declined dramatically in the three months ending May 2020 – implying a bigger credit squeeze than in the worst three-month period of the global financial crisis.
Chart of the Week
Wayne Rooney decried that ‘[If] Manchester United or Man City need 30 per cent of their players’ wages to survive… then football is in a far worse position than any of us imagined.’.


