
As gas and electricity prices rise by 10% in England, Scotland, and Wales from October, many households are feeling the pressure. With the new energy price cap in place, the typical annual dual-fuel bill will increase to £1,717, leaving many wondering how to manage the rising costs. Adding to the strain, the government has announced […]
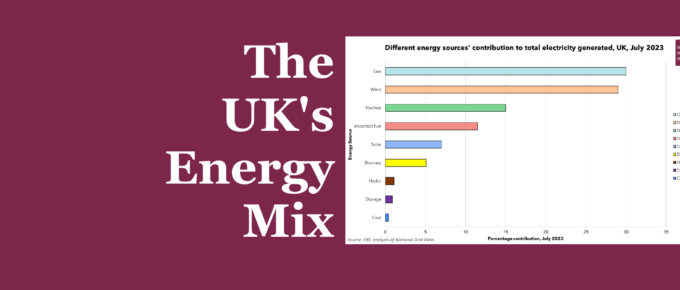
Chart of the Week
With energy as a key component in the heightened cost of living, the ongoing conflict in Europe has highlighted the importance of energy self-sufficiency; as new oil and gas licences cast doubt upon the UK’s commitment to net zero emissions by 2050.
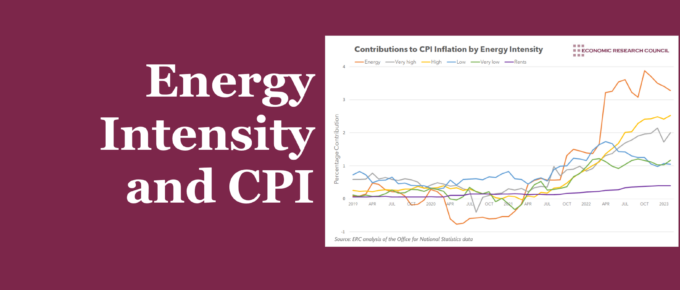
Chart of the Week
This week, we delve into the impact of changes in the price of different energy-intensity goods and services on the 12-month CPI inflation rate in the UK, illustrating the growing effect of energy-intensive components on inflation rates.
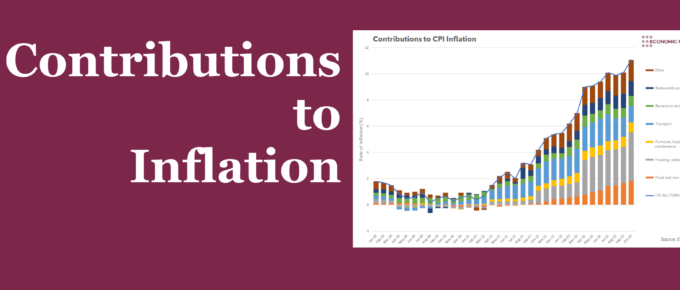
Chart of the Week
Summary October’s headline inflation rate of 11.1% was largely led by two groups: Housing, water, electricity, gas and other fuels, and Food. This week’s chart assesses the drivers behind these groups, to judge their likely trajectory into 2023. What does the chart show? The chart shows the contribution to the overall year-on-year rate of inflation […]
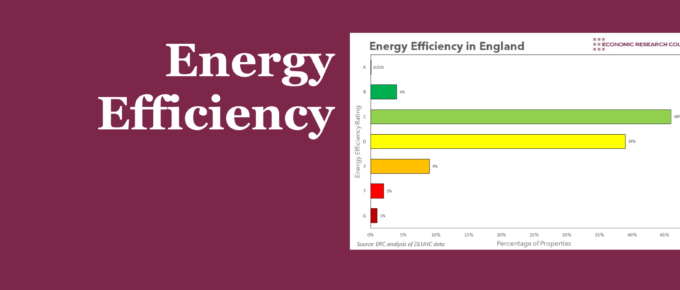
Chart of the Week
Whilst efforts have been made to improve efficiency, they have often ended in failure. A coordinated and committed approach is needed to reduce reliance on fossil fuels, and lower household bills.
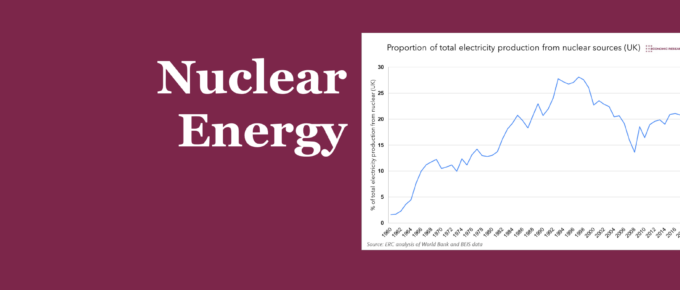
Chart of the Week
As issues such as sustainability and energy independence face the country, perhaps the energy mix requires a review.