As we near the deadline for Clash of the Titans entries, we thought we’d provide you with a sense of the economic outlook moving through 2023. The chart displays the 2023 GDP forecasts of several institutions. These convey a sense of pessimism, with the average forecast being -0.76%. Consensus suggests the UK will experience a […]
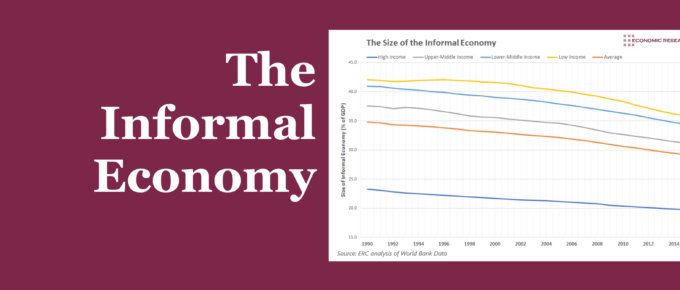
Chart of the Week
A significant proportion of economic activity occurs but is not captured by official GDP statistics in countries around the world
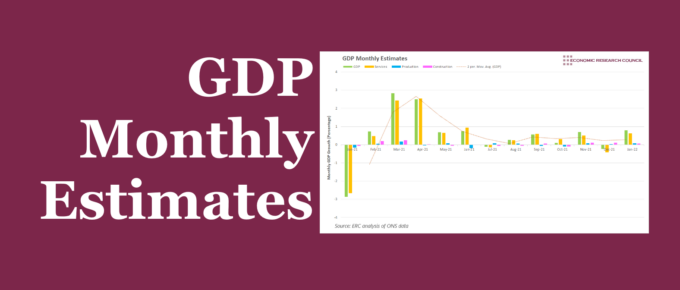
Chart of the Week
Since March of 2021, every month but July and December has seen steady growth. The two negative months have had almost no effect on the general trend of consistent and steady growth.
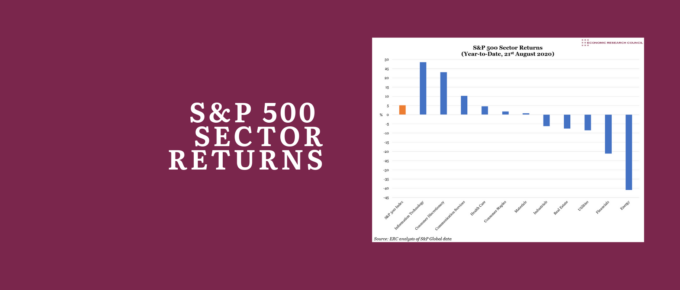
Chart of the Week
Investors have flocked to those sectors which they believe will benefit from lasting post-pandemic trends, and avoided those that have proven less resilient – with Information Technology up 29% at one extreme, and Energy down 41% at the other.
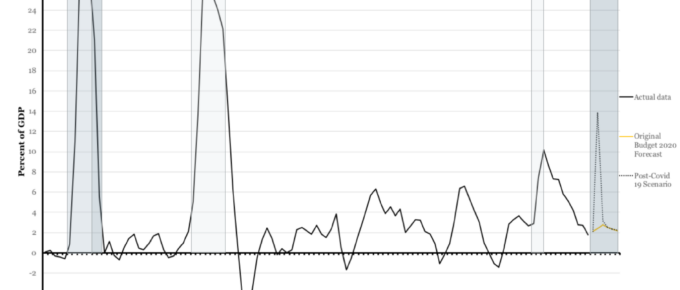
Historical Public Sector Net Borrowing: Post-Covid 19 Forecast
Despite the unprecedented and, as yet, incalculable, cost of government measures, the OBR have stated that ‘we can be confident that the cost of inaction would ultimately have been much higher.’.
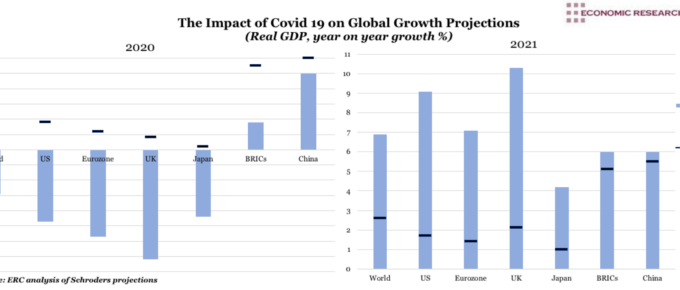
The Impact of Covid 19 on Global Growth Projections
Researchers from Imperial College London predicting that ‘transmission will quickly rebound if interventions are relaxed.’. If this causes reintroduction of measures, then a double-dip recession looms. Indeed, should the spread of the virus maintain this pace, a sustained decline is