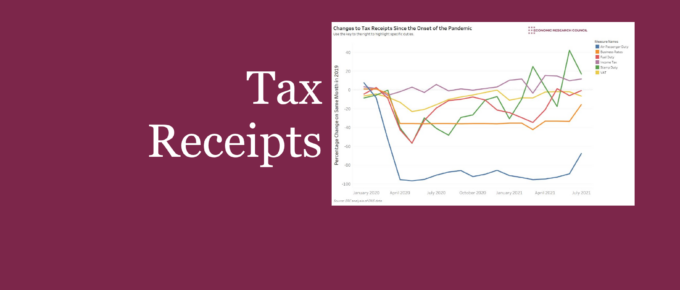
Tax receipts were pummelled due to lower economic activity associated with the COVID pandemic. This chart highlights the development of notable duties that together help to highlight the effect of the pandemic on government income. Use the interactive chart to focus on specific duties.
Chart of the Week
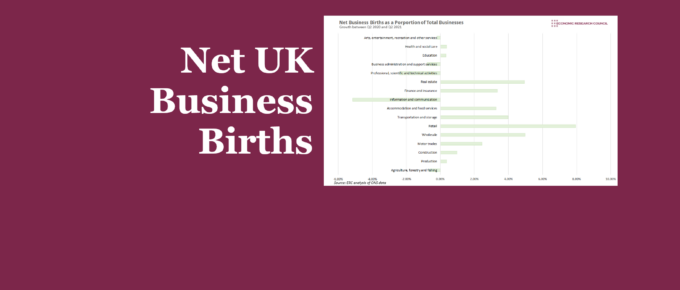
Assessing business births and deaths provides another angle to test perceptions of the UK economy, placing greater emphasis on the plight of smaller businesses that account for 60% of private sector employment in the UK.
Chart of the Week
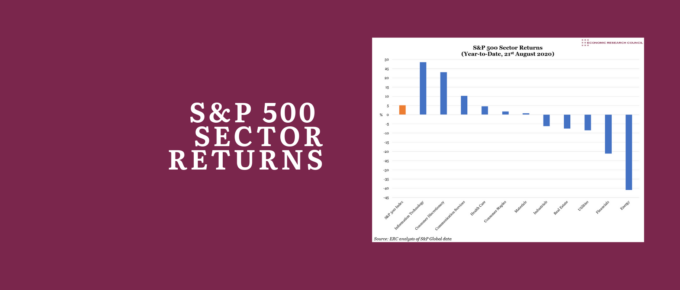
Investors have flocked to those sectors which they believe will benefit from lasting post-pandemic trends, and avoided those that have proven less resilient – with Information Technology up 29% at one extreme, and Energy down 41% at the other.
Chart of the Week
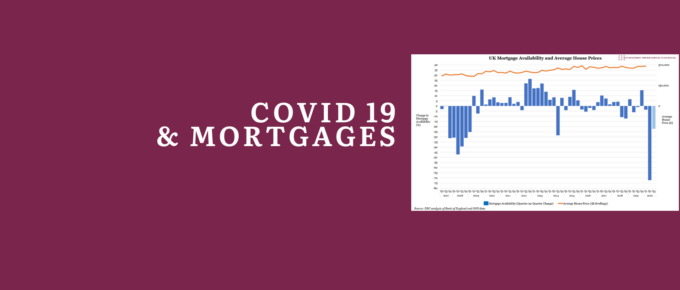
According to the Bank of England, the availability of mortgages declined dramatically in the three months ending May 2020 – implying a bigger credit squeeze than in the worst three-month period of the global financial crisis.
On the state of UK Business Closures
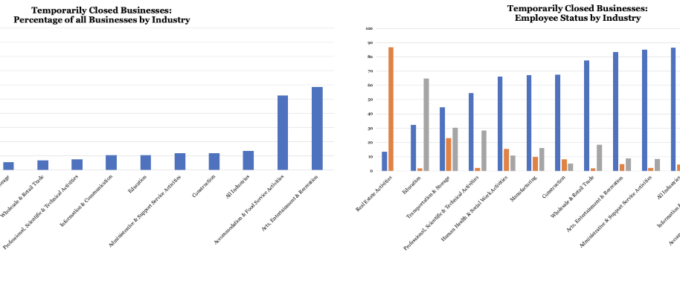
13.5% of all UK businesses have temporarily closed or paused trading, during the lockdown, with 86.4% of workers in these businesses on furlough.
May 2020
Since April we have seen politicians around the world trying to roll back on the panic created by the Corona Virus. The machinery of government and its institutions, particularly areas involved in health, led by the World Health Organisation, embraced the idea of pandemic and effectively shut down the world’s economy.

