Summary As UK’s bank rate hits a 13-year high, its impact reverberates through the economy, with disposable incomes shrinking and inflation spiralling. Amidst this, debates rage on the true culprits behind soaring inflation. We present an incisive analysis of the UK’s economic landscape, from the plight of mortgagors and renters to the potential pitfalls of […]
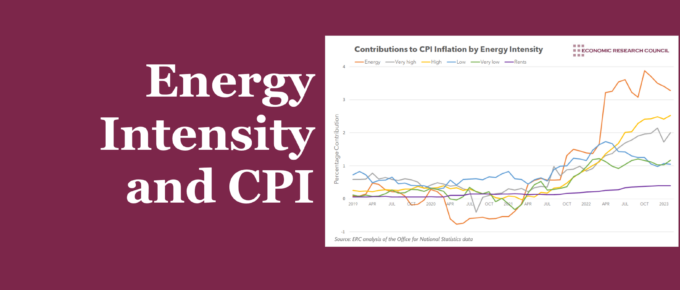
Chart of the Week
This week, we delve into the impact of changes in the price of different energy-intensity goods and services on the 12-month CPI inflation rate in the UK, illustrating the growing effect of energy-intensive components on inflation rates.
Chart of the Week
As we near the deadline for Clash of the Titans entries, we thought we’d provide you with a sense of the economic outlook moving through 2023. The chart displays the 2023 GDP forecasts of several institutions. These convey a sense of pessimism, with the average forecast being -0.76%. Consensus suggests the UK will experience a […]
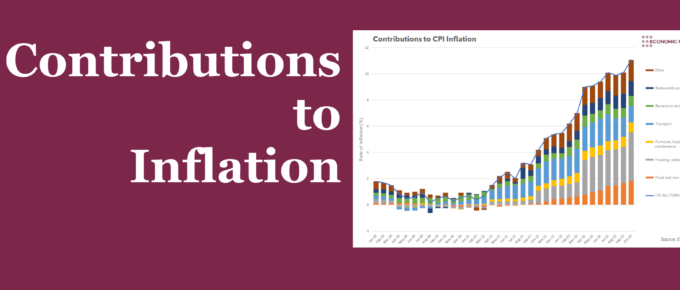
Chart of the Week
Summary October’s headline inflation rate of 11.1% was largely led by two groups: Housing, water, electricity, gas and other fuels, and Food. This week’s chart assesses the drivers behind these groups, to judge their likely trajectory into 2023. What does the chart show? The chart shows the contribution to the overall year-on-year rate of inflation […]
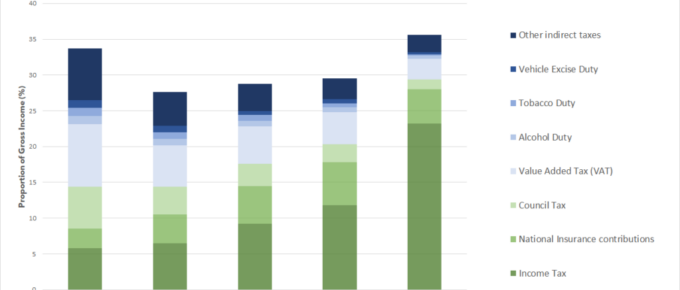
Chart of the Week
This week’s chart examines the main taxes in the UK, assessing the extent to which they can be seen as progressive or not.
Chart of the Week
These statistics combine to emphasise the mantra that many people are choosing between “heating and eating”.