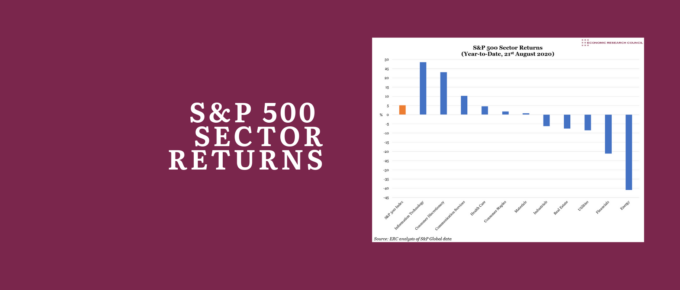
Investors have flocked to those sectors which they believe will benefit from lasting post-pandemic trends, and avoided those that have proven less resilient – with Information Technology up 29% at one extreme, and Energy down 41% at the other.
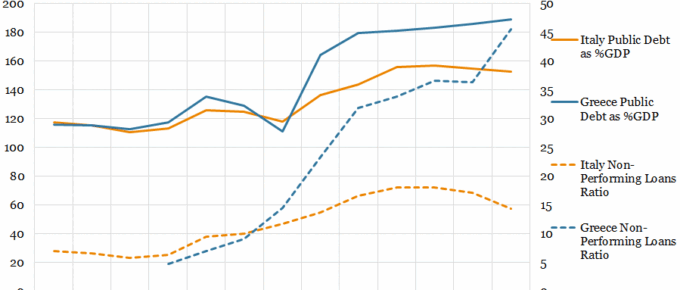
Chart of the Week: Italian and Greek Non-Performing Loans vs Public Debt
The chart demonstrates that, although Italy and Greece share a similar narrative in terms of poor loan performance across business, personal and residential loans; they have experienced widely differing outcomes. This reflects….
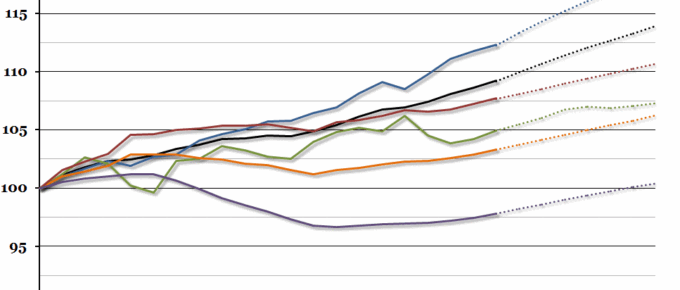
Chart of the Week: Week 15, 2015: IMF Growth Forecasts
The International Monetary Fund (IMF) release their twice yearly World Economic Outlook report in April, and it contains a great deal of data and forecasts.


