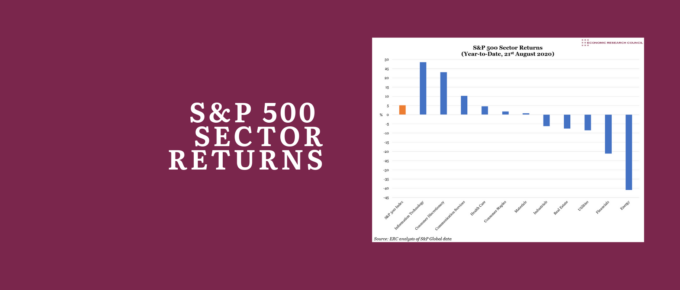
Investors have flocked to those sectors which they believe will benefit from lasting post-pandemic trends, and avoided those that have proven less resilient – with Information Technology up 29% at one extreme, and Energy down 41% at the other.
Chart of the Week
We invite you to explore the data, by clicking on each nation outlined in bold. You will then see companies headquartered in the country displayed on a graph showing the gains in their market capitalisation since the pandemic.
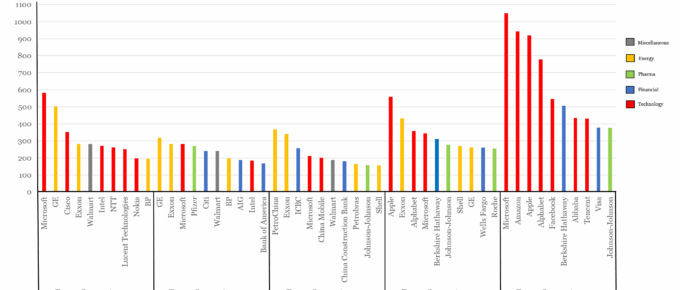
Top Ten Companies by Market Cap over 20 Years
There have been tech booms and oil crashes, bull and bear markets, and periods of retail dominance. However, two companies which have been models of consistency (at least in regard to market cap) are Microsoft and…
Responding to Tech Giants
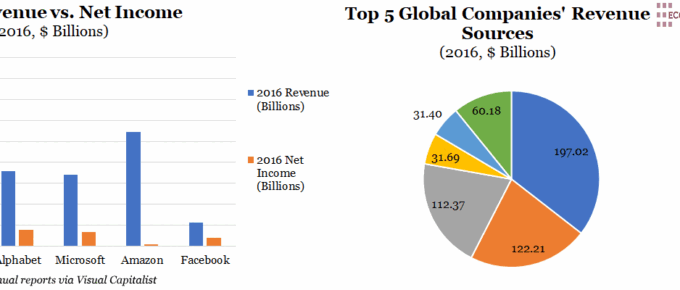
Despite the rapid development of tech giants since the turn of the millenium, there has also been interesting discussion of their ability to sustain such impressive growth. This year, Apple iPhone sales declined for ….
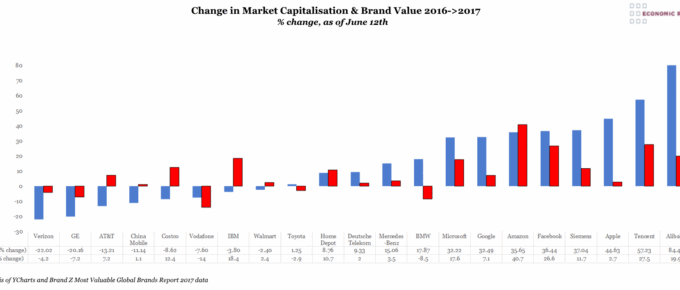
Chart of the Week: Week 27, 2017: Change in Market Capitalisation and Brand Value
This chart shows the performance of a number of brands detailing the changes in both their stock market capitalisation and brand value over the past year.


