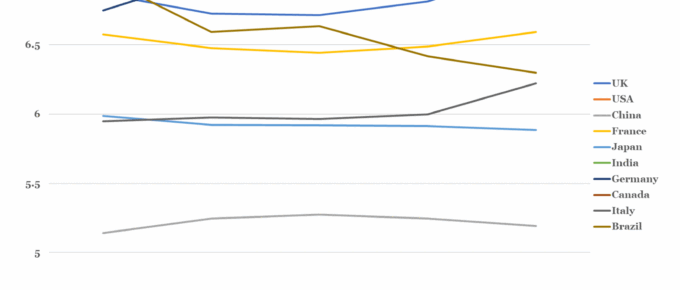
Out of the countries shown, the UK is perhaps the most confounding. Over the data period it has experienced significant political upheaval and societal division, centered around the Brexit vote. In 2016, the statistics suggest that Britain actually became happier and has remained on this trend until the end of the data period…
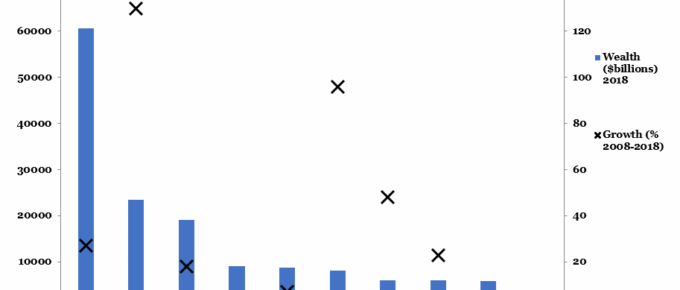
10 Biggest Wealth Markets: 2018 Wealth vs Growth 2008-2018
As much as one could look to political differences or motivations, the single biggest boon for wealth growth has been global loose monetary policy with near zero interest rates and significant QE, which serves …
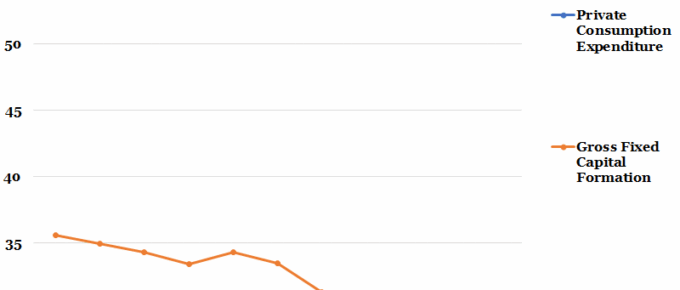
Indian Consumption and Investment as a Percentage of GDP
With elections looming in April/May, the Modi administration has recently released an interim Union Budget proposing policies that offer a rebate to taxpayers earning up to 500,000 rupees (7000 USD), benefitting…
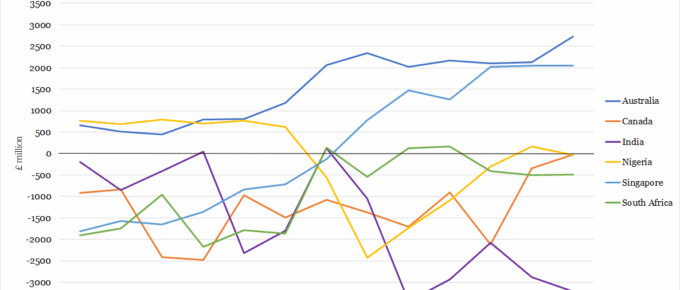
Chart of the Week: UK Trade Balance with Largest Commonwealth Economies
Already existent strong trade ties between neighbouring nations could potentially prove limiting for Britain’s trade expansion …
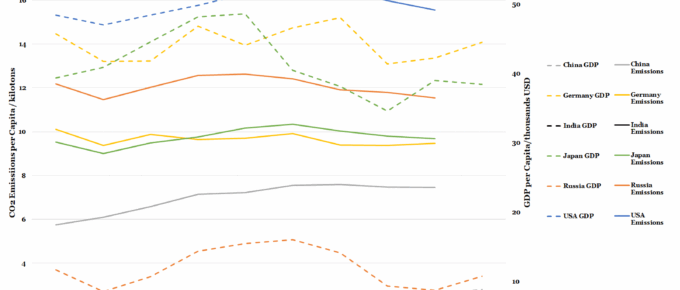
Chart of the Week: Six Highest Polluting Nations’ Emissions vs GDP
Despite China experiencing GDP growth of 6.9% and a CO2 emissions rise of 1.4% last year, the nation had …
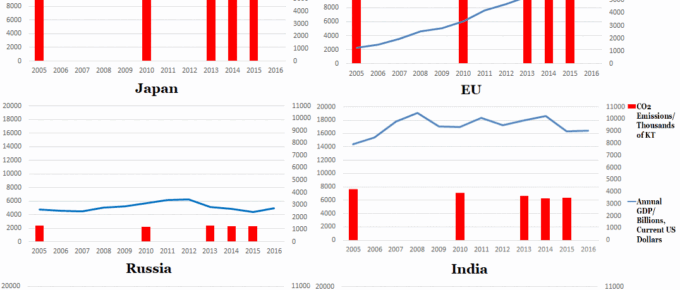
Chart of the Week: Week 29, 2017: Top 6 Polluters’ Emissions v.s. GDP
The set of graphs generally indicates that developed countries are beginning to reduce their emissions, whereas India and China are seeing their emissions rise, as they undertake vast infrastructure projects and continue to lift sizeable populations out of poverty.

