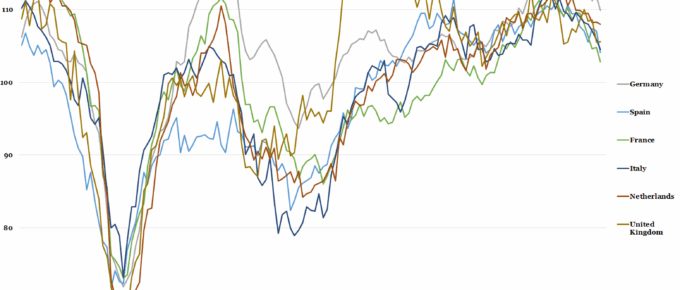
The European Commission has tempered expectations and pointed out that the index itself remains at an overall high level and other indicators, such as industrial capacity utilisation, remain well above their average level over….
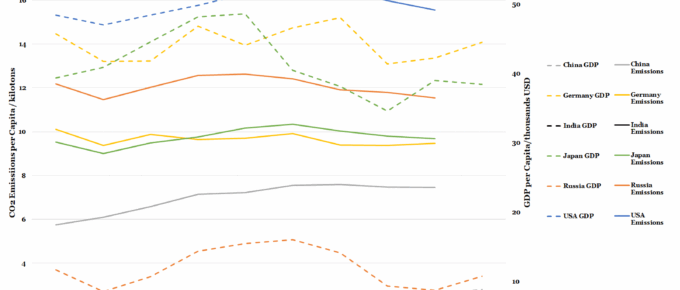
Chart of the Week: Six Highest Polluting Nations’ Emissions vs GDP
Despite China experiencing GDP growth of 6.9% and a CO2 emissions rise of 1.4% last year, the nation had …
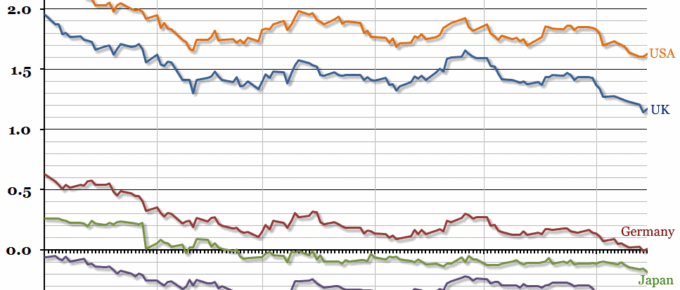
Chart of the Week: Week 24, 2016: Global Government Bonds
Government bond yields in most advanced economies reached record lows this week, with ten year German bond yields entering negative territory for the first time ever.
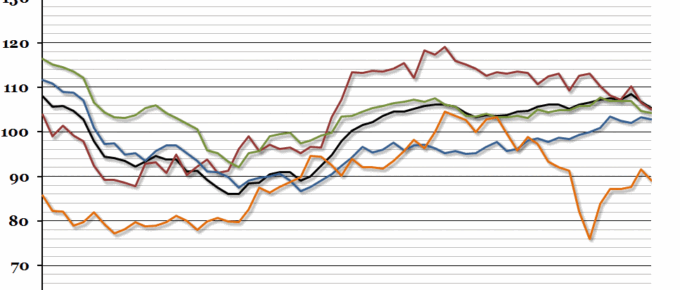
Chart of the Week: Week 12, 2016: Economic Confidence
This week marks the fifth anniversary of the Economic Research Council’s Chart of the Week.
December 2015
Apart from the normal and incalculable unknown unknowns, a possible debt explosion or a Putin play, 2016 is likely to see a steady improvement in the economic environment. 2 to 3% growth with near zero inflation is really quite benign. With Governments, albeit at glacial speed…
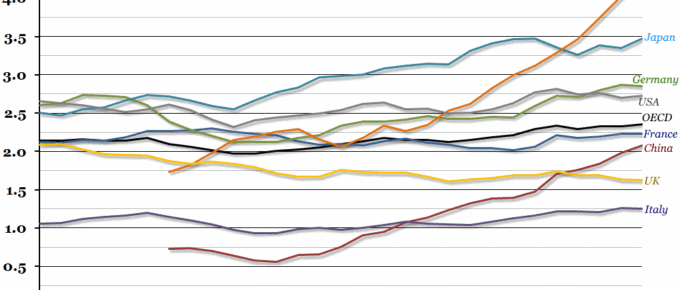
Chart of the Week: Week 47, 2015: International R and D Spending
Spending on research and development has been comparatively low in the UK for some time, but it has decreased since the financial crisis.

