In recent years, the digital nomad lifestyle has gained significant traction, driven by advances in technology, the rise of remote working, and shifting attitudes towards work-life balance.
Chart of the Week
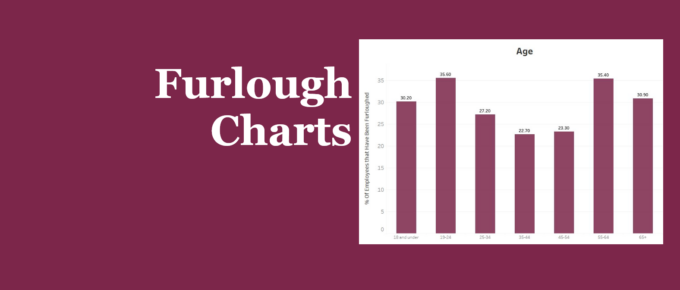
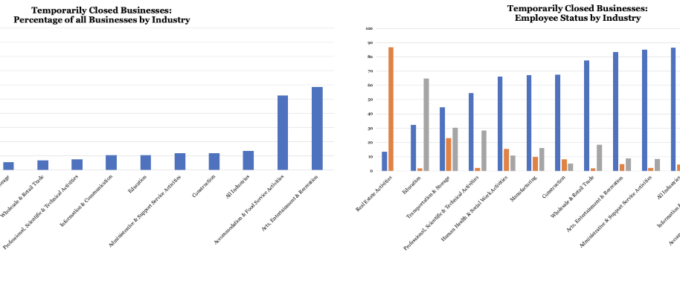
Our chart presents recent statistics on furloughed staff throughout the pandemic. Younger and older people were both more likely to be furloughed compared to those in between. Those with high levels of education have been less likely to be placed on furlough, while the industries that were most an least effected correlate with the extent they have been able to remain open through the pandemic.
Chart of the Week
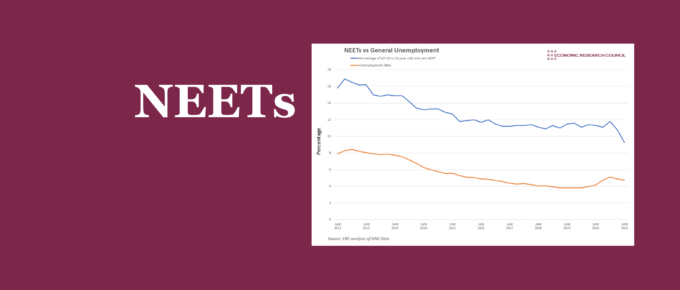
The turn of the year brought a rapid reduction in NEETs relative to general unemployment. Higher education has had a significant impact on this figure. Whilst employment in 16-24 year olds seems to play a part, a broader assessment presents concerning conclusions.
Chart of the Week
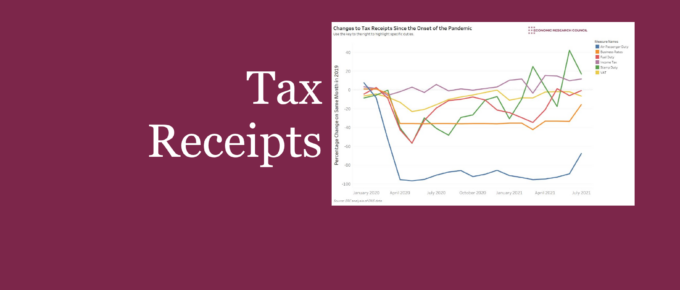
Tax receipts were pummelled due to lower economic activity associated with the COVID pandemic. This chart highlights the development of notable duties that together help to highlight the effect of the pandemic on government income. Use the interactive chart to focus on specific duties.
Chart of the Week
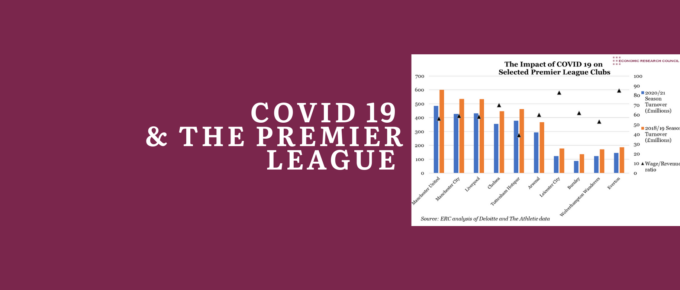
Wayne Rooney decried that ‘[If] Manchester United or Man City need 30 per cent of their players’ wages to survive… then football is in a far worse position than any of us imagined.’.
On the state of UK Business Closures
13.5% of all UK businesses have temporarily closed or paused trading, during the lockdown, with 86.4% of workers in these businesses on furlough.


