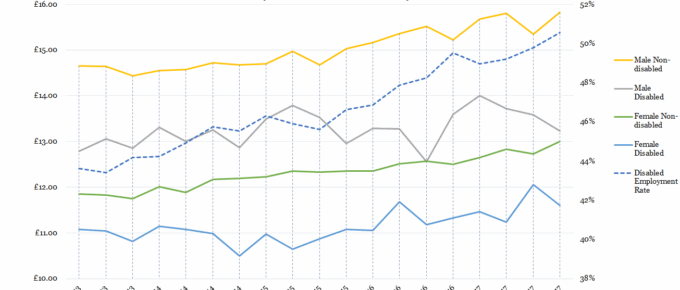
While non-disabled men’s and women’s wages have been incrementally rising since 2013, those of their disabled counterparts…
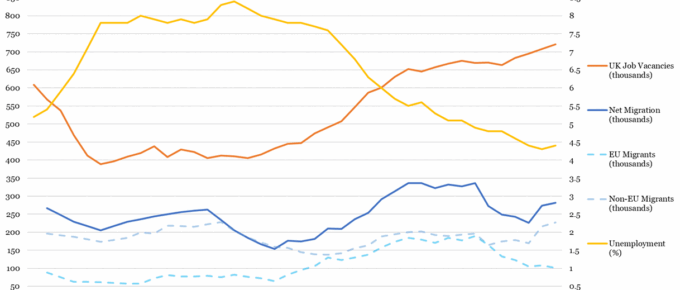
Chart of the Week: Week 29, 2018: Historical UK Unemployment & Vacancies vs Migration
Following the recession, unemployment increased to its highest level since 1995 at 8.4% of the workforce in 2011 Q4. It has since recovered, halving to its current rate of 4.2%, (898,700 persons) , its lowest since 1975. Recent trends in job vacancies and unemployment are…
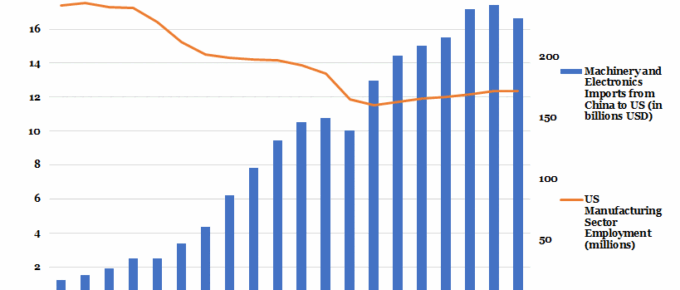
Chart of the Week: Week 28, 2018: Imports of Machinery and Electronics from China to US vs US Employment in the Manufacturing Sector
Imports from China into the USA have increased more than sixfold in the last twenty years, with the US trade deficit with China currently at $336 billion. ‘Made in China 2025’, the Chinese government drive to dominate the global market in 10 sectors…
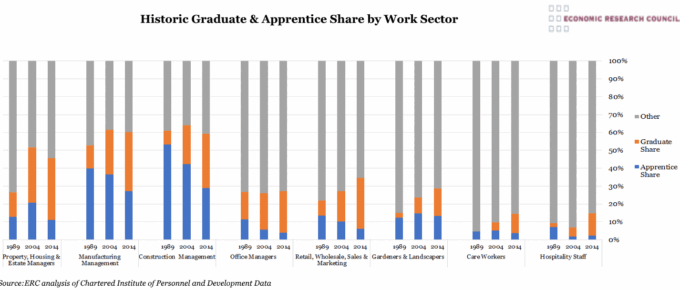
Chart of the Week: Week 31, 2017: Historic Graduate and Apprentice Share by Work Sector
This chart shows the increasing graduate share and declining apprenticeship share in the workforce within selected work sectors since the late 1980s.
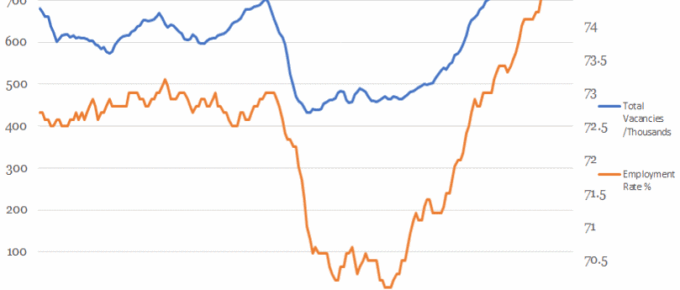
Chart of the Week: Week 25, 2017: Vacancies v.s. Employment Rate
This chart shows that the overall employment rate has been tracked by the number of available jobs until the financial crash.
Chart of the Week: Week 28, 2016: Self Employment
The age distribution of self-employed people helps to reveal some of the possible causes of this shift away from traditional employment.