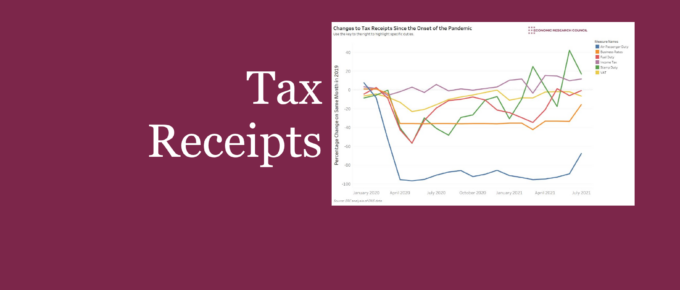
Tax receipts were pummelled due to lower economic activity associated with the COVID pandemic. This chart highlights the development of notable duties that together help to highlight the effect of the pandemic on government income. Use the interactive chart to focus on specific duties.
Chart of the Week
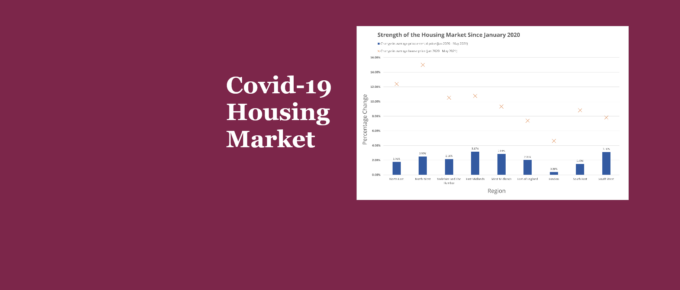
The pandemic, as well as the government’s response to it, has accelerated the growth in house prices relative to rental prices, and weakened the London housing market relative to the rest of England.
Chart of the Week
All the indicators point toward a sweet and sour year for start-ups. While UK tech startups raised €5.3 billion in venture capital funding between January and May 2020, similar to in 2019, the optimism appears to be subsiding in the second half of the year.
On the state of UK Business Closures
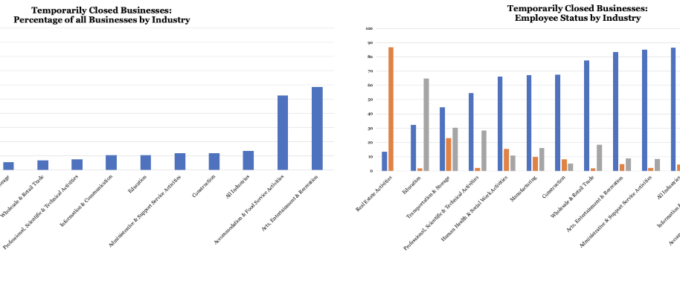
13.5% of all UK businesses have temporarily closed or paused trading, during the lockdown, with 86.4% of workers in these businesses on furlough.
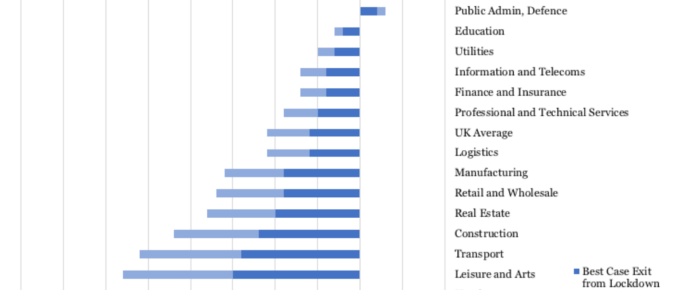
Exiting the Lockdown: The Range of Impact on GVA by Sector
It is imperative that the public are informed in a cogent, digestible and evidence-based manner on how best to limit new infections as the economy begins to get back on track. In the absence of clear, authoritative information that
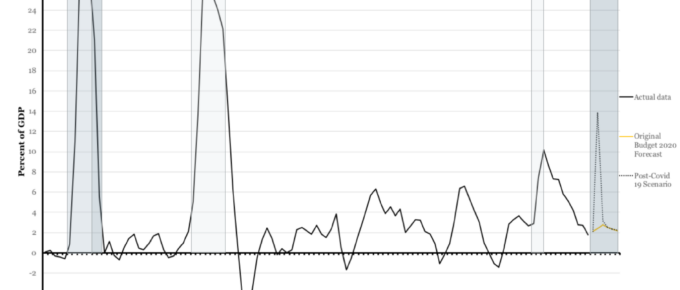
Historical Public Sector Net Borrowing: Post-Covid 19 Forecast
Despite the unprecedented and, as yet, incalculable, cost of government measures, the OBR have stated that ‘we can be confident that the cost of inaction would ultimately have been much higher.’.

