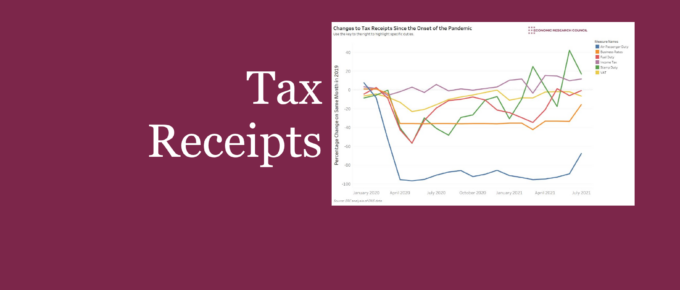
Tax receipts were pummelled due to lower economic activity associated with the COVID pandemic. This chart highlights the development of notable duties that together help to highlight the effect of the pandemic on government income. Use the interactive chart to focus on specific duties.
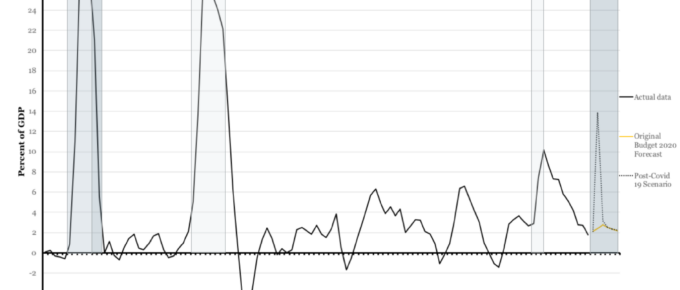
Historical Public Sector Net Borrowing: Post-Covid 19 Forecast
Despite the unprecedented and, as yet, incalculable, cost of government measures, the OBR have stated that ‘we can be confident that the cost of inaction would ultimately have been much higher.’.
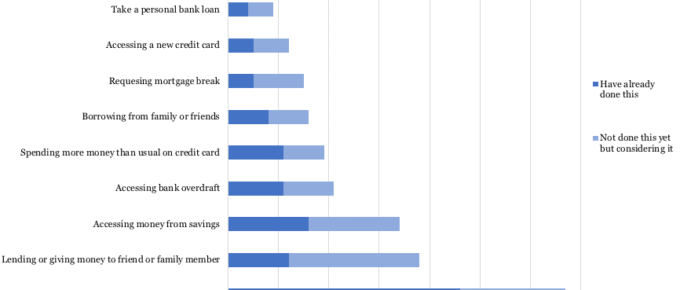
Covid 19: How are people are making ends meet?
There is a risk that following the shock of the pandemic and poor economic recovery, deep seated pessimism may set in for the young, who already feel that their lives will be less prosperous than their parents’.
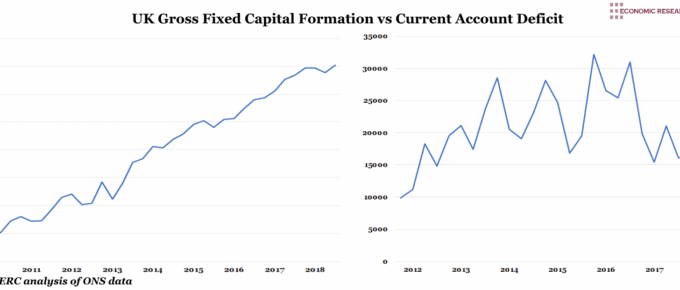
UK Gross Fixed Capital Formation v.s. Current Account Deficit
The longer Brexit negotiations continue to stall, the longer any votes are delayed and the status-quo persists, the more economic actors will simply revert to their old behaviours…
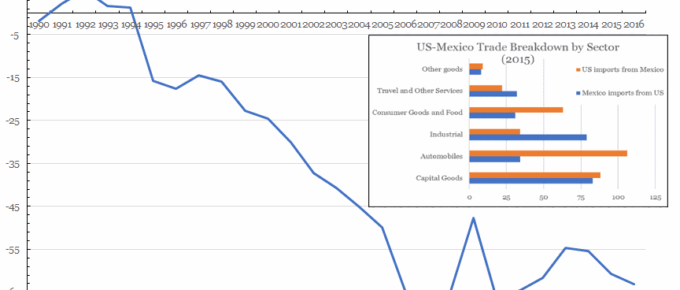
Chart of the Week: Week 5, 2017: US Trade with Mexico
The chart shows that the US has been in trade deficit with Mexico since Clinton came to power, with George Bush Jnr presiding over the period with the largest deficit increase; around $29 billion.
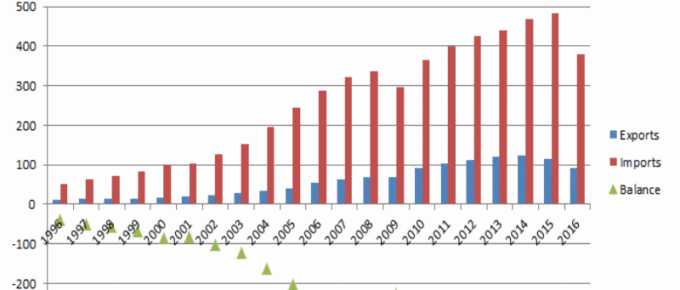
Chart of the Week: Week 50, 2016: US Trade in Goods with China
The chart demonstrates the extent to which the two countries’ economies are intertwined and the enormity of the US trade deficit with China, which has only increased in the last two decades.

