Since 2011, new business formation has outstripped business closures, with the gap widening until the beginning of 2016…
Latest Blogposts
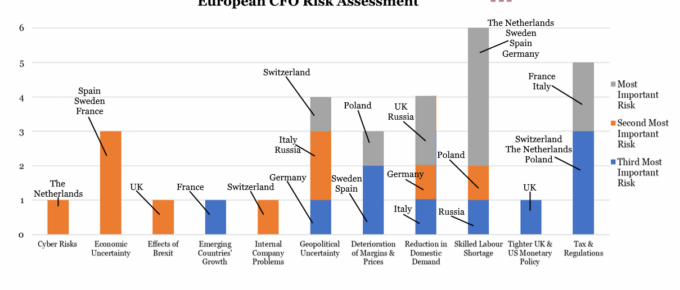
Chart of the Week: European CFO Risk Assessment
CFOs of the largest European nations, excluding the UK, do not express explicit concern about the effects of Brexit…
Chart of the Week: Week 33, 2018: House Price Change by Region
London has long been a boon to UK average house price growth, but following a slide sparked by the referendum in summer 2016, growth
Chart of the Week: Week 32, 2018: Households, Taxes and Benefits over the Last Decade
Following the 2010 election, Labour lost power to a Conservative -Liberal Democrat coalition, which introduced sweeping austerity legislation. Described by the FT at the time as the’ most drastic…in living memory’, the budget cuts amounted to £81 billion over…

August 2018
The market setback for the technology companies seems mostly to have been driven by a relatively small amount of selling into a market that is suffering from a lack of so-called ‘market makers’. These thin and volatile…
Chart of the Week: Week 31, 2018: FDI Rates of Return by Region
Global FDI rate of return (RoR)has dropped from an average of 8.1% in 2012 to 6.7% in 2017, the largest drop…