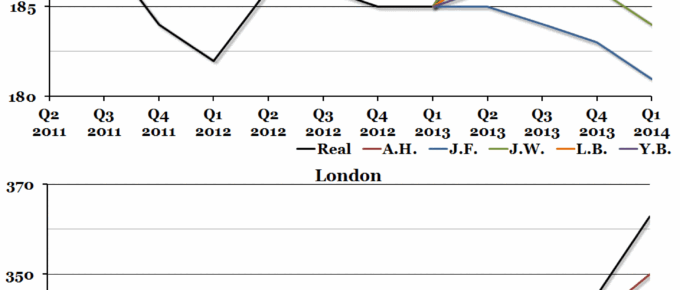
This time last year, the Economic Research Council invited four property experts to share their forecasts for house prices in the coming year.
Chart of the Week: Week 23, 2014: Average House Prices
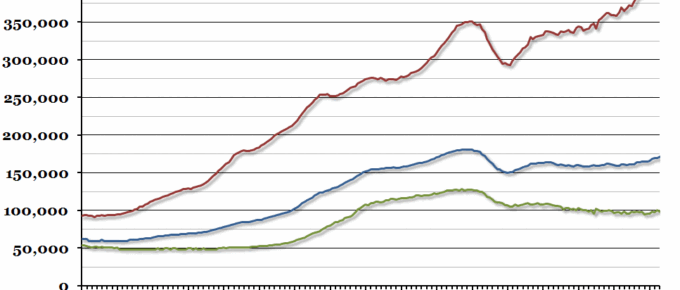
At the end of last week, the Land Registry published their House Price Index data for April 2014 which showed that over the whole of England and Wales, house prices went up by 1.5% on the previous month and 6.7% on the same time last year.
Chart of the Week: Week 22, 2014: UK GDP Growth by Sector
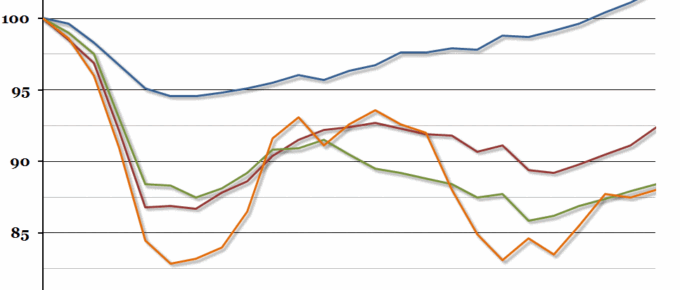
When the second estimate of Q1 GDP was released at the end of last week, the preliminary growth rate of 0.8% remained unchanged.
Chart of the Week: Week 21, 2014: UK Wealth Distribution
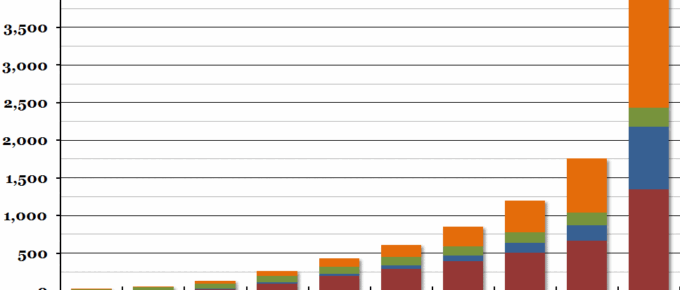
Towards the end of last week, the third wave of the Office for National Statistics’ “Wealth in Great Britain” report was released.
Chart of the Week: Week 20, 2014: UK Labour Market
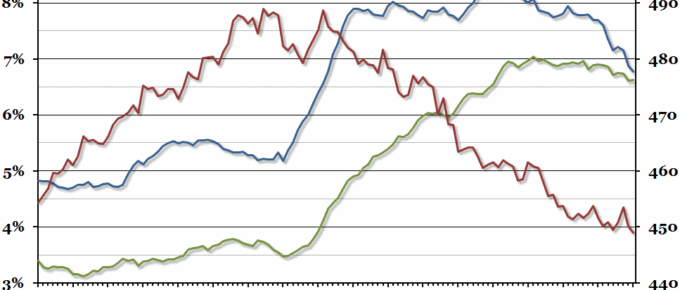
The official UK unemployment rate continued its sharp decline in the three months to March.
Chart of the Week: Week 19, 2014: UK Healthcare Spending
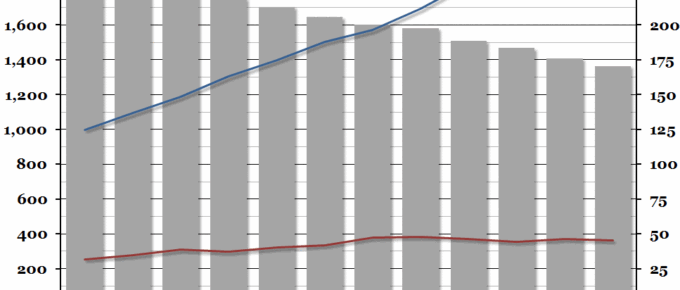
Per capita healthcare spending in the UK has slowed down massively since the 2008 recession, with spending on private healthcare decreasing even in nominal terms since the peak in 2007.

