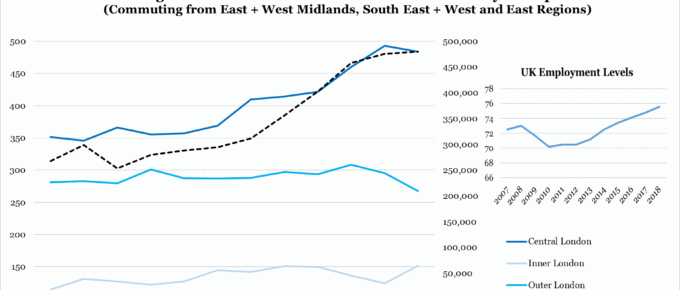
London had the least affordable housing, with a ratio of 11.98, meaning workers required nearly 12 times their annual salary to purchase a home. Although some of the highest wages are concentrated in London…
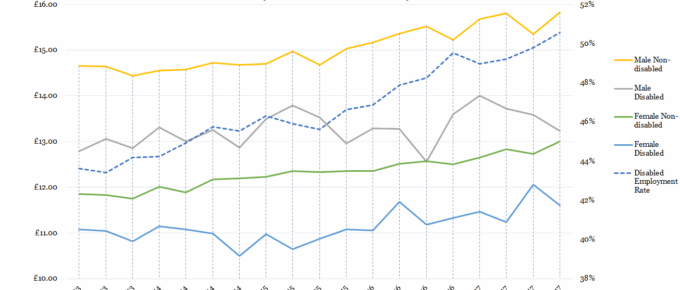
Chart of the Week: Gender, Disability, Wages and Employment
While non-disabled men’s and women’s wages have been incrementally rising since 2013, those of their disabled counterparts…
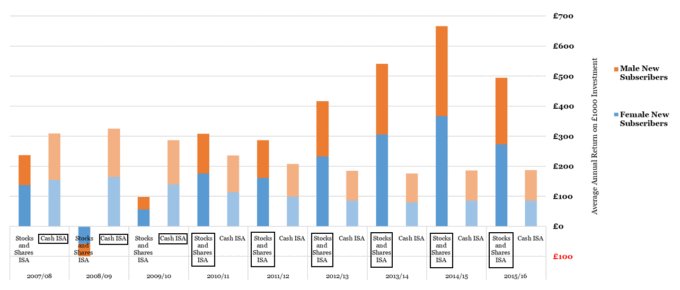
Chart of the Week: Week 27, 2018: Gender Split and Returns of Cash vs Stocks and Shares ISAs
In general, women hold more ISAs than men (an average of 52% across ISA products), however in every year displayed, men are more likely to opt for stocks and shares ISAs when they do invest in ISAs. The number of men subscribing to new ISAs has fallen in recent years, reflecting an increased appetite for other, higher-risk investments…
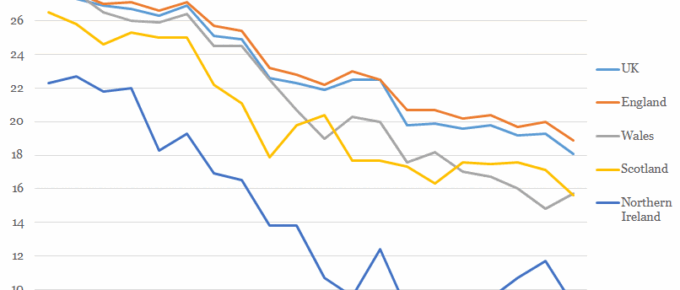
Chart of the Week: Week 13, 2017: Gender Pay Gap by Country
This Tuesday 4th April was ‘Equal Pay Day’, a date symbolically chosen in the USA for two reasons: it roughly represents the date when the average woman would need to work to, from 1st of January 2016, to match the average man’s 2016 earnings.


