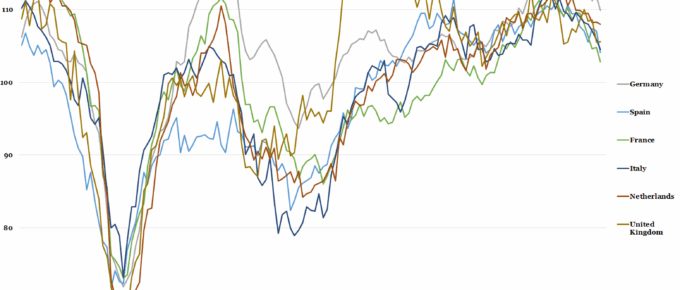
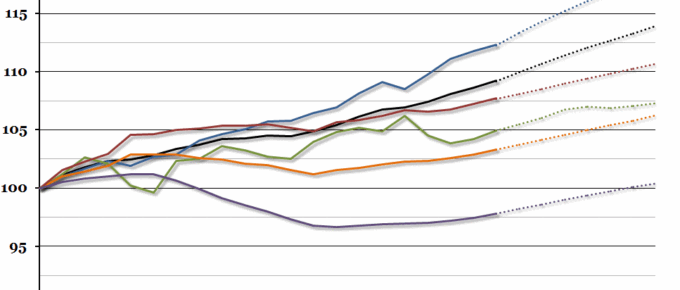
The European Commission has tempered expectations and pointed out that the index itself remains at an overall high level and other indicators, such as industrial capacity utilisation, remain well above their average level over….
Chart of the Week: Week 12, 2016: Economic Confidence
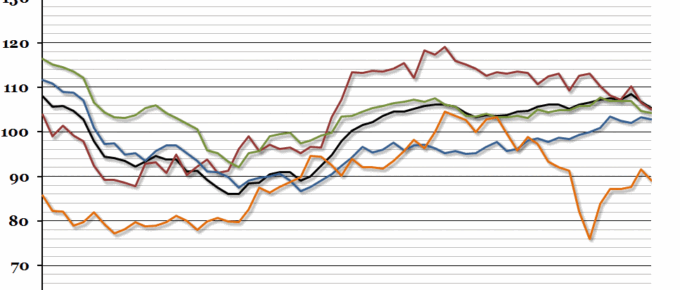
This week marks the fifth anniversary of the Economic Research Council’s Chart of the Week.
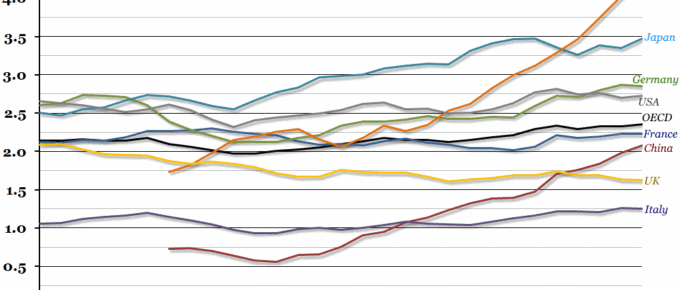
Chart of the Week: Week 47, 2015: International R and D Spending
Spending on research and development has been comparatively low in the UK for some time, but it has decreased since the financial crisis.
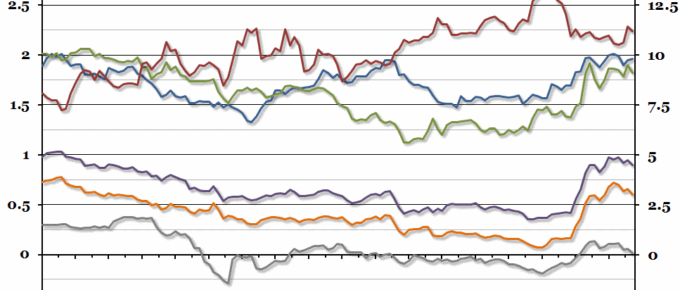
Chart of the Week: Week 20, 2015: European Government Bonds
There have been some interesting movements in the European government bond markets over the past 6 months, ranging from incredible negative yields on 10 year Swiss bonds through to almost 14% yields on Greek bonds.
Chart of the Week: Week 15, 2015: IMF Growth Forecasts
The International Monetary Fund (IMF) release their twice yearly World Economic Outlook report in April, and it contains a great deal of data and forecasts.
Chart of the Week: Week 39, 2014: European Government Deficits
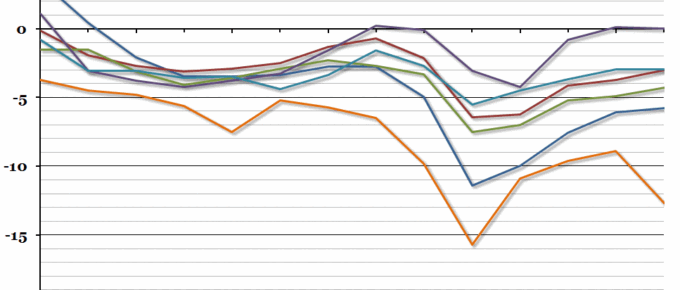
UK public sector finances were released yesterday, showing that the deficit so far this financial year is higher than last year.

