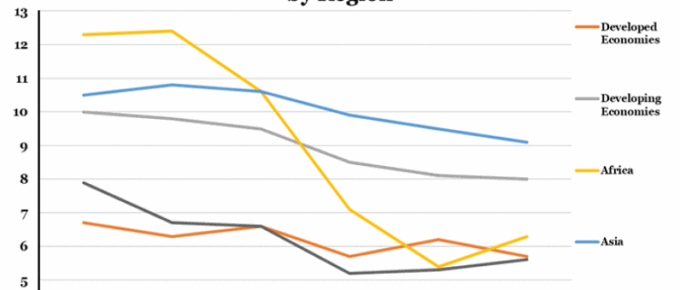
Global FDI rate of return (RoR)has dropped from an average of 8.1% in 2012 to 6.7% in 2017, the largest drop…
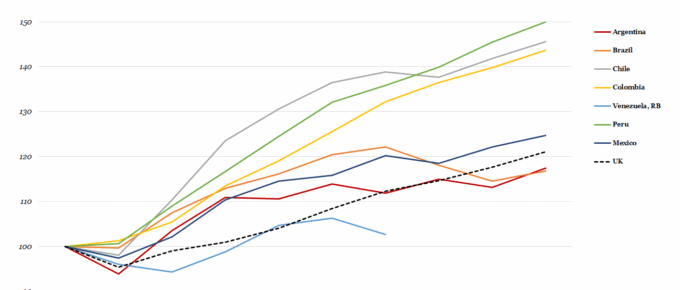
Chart of the Week: Week 30, 2018: GDP per Capita of Latin America’s 7 Largest Economies
The post-recession trends in GDP per capita of South America’s seven largest economies have varied over the last decade. All economies were affected differently by the 2008 financial crisis but…
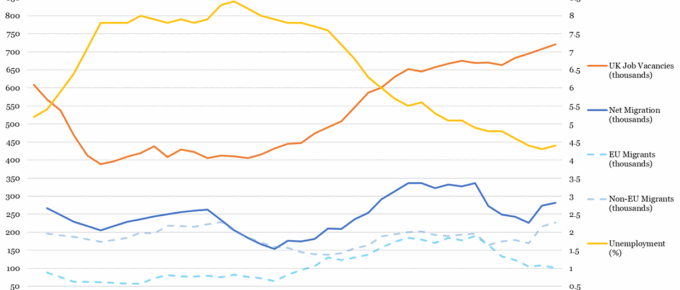
Chart of the Week: Week 29, 2018: Historical UK Unemployment & Vacancies vs Migration
Following the recession, unemployment increased to its highest level since 1995 at 8.4% of the workforce in 2011 Q4. It has since recovered, halving to its current rate of 4.2%, (898,700 persons) , its lowest since 1975. Recent trends in job vacancies and unemployment are…
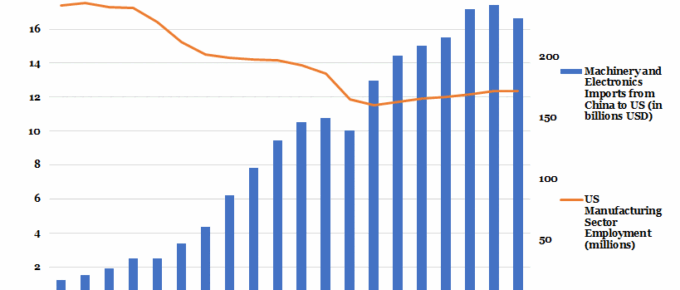
Chart of the Week: Week 28, 2018: Imports of Machinery and Electronics from China to US vs US Employment in the Manufacturing Sector
Imports from China into the USA have increased more than sixfold in the last twenty years, with the US trade deficit with China currently at $336 billion. ‘Made in China 2025’, the Chinese government drive to dominate the global market in 10 sectors…
Celebrating the NHS’s 70th: Will it Innovate or Stagnate?
In mid-May, Economic Research Council in partnership with Optimity Advisors invited 3 experienced healthcare innovators to share their views at an event titled: ‘Innovate or Stagnate: Can Technology keep the NHS healthy at 70?’
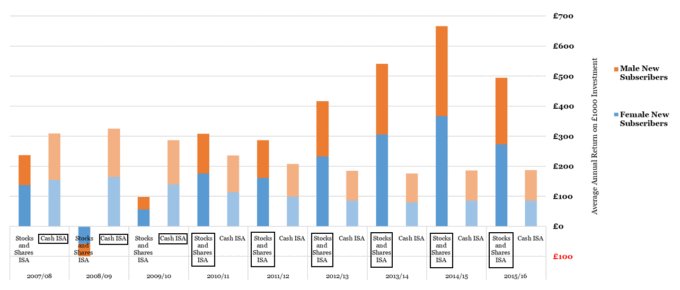
Chart of the Week: Week 27, 2018: Gender Split and Returns of Cash vs Stocks and Shares ISAs
In general, women hold more ISAs than men (an average of 52% across ISA products), however in every year displayed, men are more likely to opt for stocks and shares ISAs when they do invest in ISAs. The number of men subscribing to new ISAs has fallen in recent years, reflecting an increased appetite for other, higher-risk investments…

