Summary
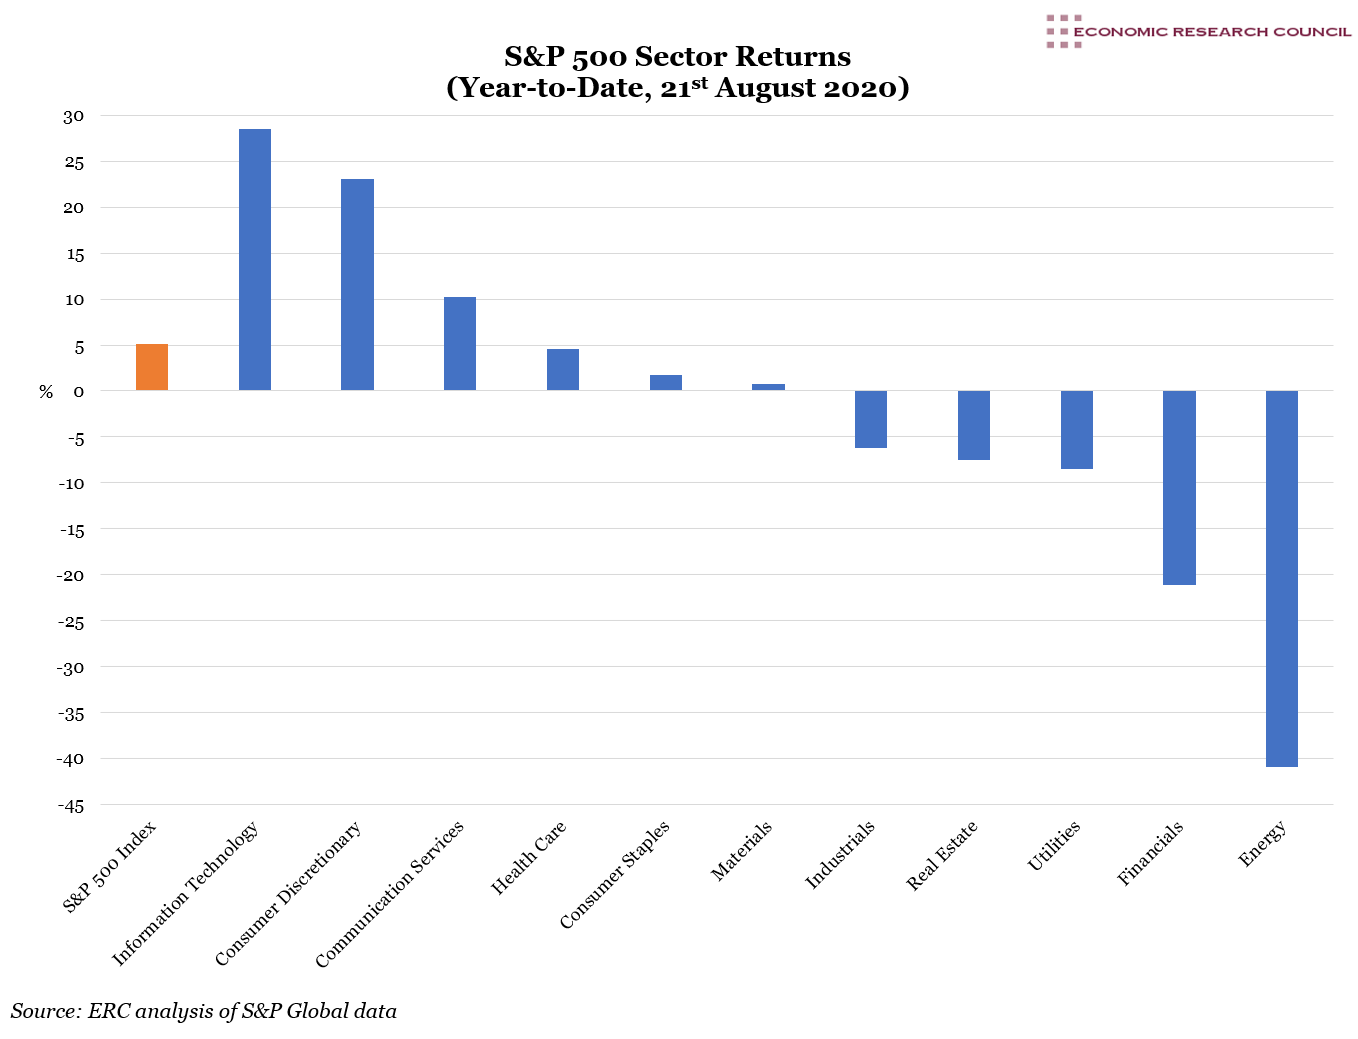
The S&P 500 has rallied over 50% from its March low and is now up 5% in the year-to-date. However, underlying this aggregate figure, there is a large dispersion of returns across industry sectors. Investors have flocked to those sectors which they believe will benefit from lasting post-pandemic trends, and avoided those that have proven less resilient – with Information Technology up 29% at one extreme, and Energy down 41% at the other.
This has created a polarised market with a relatively small number of sectors and companies accounting for a disproportionate share of returns. In particular, the five largest technology companies – Amazon, Apple, Facebook, Alphabet (Google) and Microsoft – have increased in value 48% this year and now represent one fifth of the total market capitalisation of the S&P 500. This concentration is changing the dynamics of the stock market and creating new risks for both investors and policymakers.
What does the chart show?
The chart displays the performance of the S&P 500 index, and each of its 11 constituent sectors, in the year-to-date. The orange bar shows the percentage return of the index as a whole in the period from 1st January to 21st August 2020. The blue bars show the returns over the same period for each of the sectors that make up the index. These sectors group all the companies in the S&P 500 into 11 categories based on their primary business activities, using the Global Industry Classification Standard system.
Why is the chart interesting?
The world economy is facing its deepest recession since the 1940s, with the IMF forecasting a 4.9% contraction in global GDP in 2020. Despite this, the S&P 500 has risen 52% from its low in March, and is now in positive territory for the year. It has recovered all of its losses since the onset of the coronavirus crisis and recently closed at a record high. Moreover, the index now trades at a forward price-to-earnings ratio of 22x, approximately 50% above its 20-year average. This has led some to question whether the stock market has become overvalued and detached from economic reality.
However, looking beneath the surface at the performance of the individual sectors that make up the index, the evidence suggests that investors are being selective. They are rewarding those companies that are set to benefit from the coronavirus crisis, and punishing cyclical businesses that are vulnerable to an economic downturn. As the chart shows, most of the market’s gains this year have been driven by four sectors, with two increasing in value only marginally and five declining.
In particular, the Information Technology sector is up 29% in the year-to-date, due to the accelerated adoption of technology by both businesses and consumers as a result of the pandemic. Communication Services have also increased in value due to the growing demand for both connectivity and digital content. Perhaps surprisingly, Consumer Discretionary, up 23%, is the second highest gainer. However, one single company, Amazon, represents over 40% of this sector’s market capitalisation. Its share price has risen 78% this year due to structural trends favouring two markets in which it is the leader – e-commerce and cloud computing. The Health Care sector has also increased in value because the non-discretionary nature of health spending provides some protection from an economic downturn. The industry is also expected to benefit from other trends, including technological innovation and an ageing population.
At the other end of the spectrum, the Energy sector is down 41% due to the decline in the price of oil and the possibility of an extended imbalance of supply and demand. The Financial sector is down 21%, having been hit by the prospect of increased loan defaults and a long-term low interest rate environment. Real Estate is down 8% as it is suffering from the rise of both home working and online shopping, which are likely to reduce the future value of commercial and retail property. In addition, industrials, a cyclical sector, has declined in the context of the global economic recession.
These are all structural trends which have been accelerated – and in some cases caused – by the pandemic. They have resulted in a polarised stock market, in which a relatively small number of sectors and companies are now having a disproportionate impact on overall performance. According to a recent analysis by CNBC, between the pre-pandemic high on 19 February and the recent high on 18 August, only 38% of the shares in the S&P 500 actually increased in value. This concentration is even more striking when one examines the contribution of the five largest stocks – Amazon, Apple, Facebook, Alphabet (Google) and Microsoft. These top five companies have increased in value by 48% this year, whereas the other 495 stocks in the index have, in aggregate, fallen. In other words, the five largest stocks account for all of the gains in the S&P 500 so far this year. As a result, they also now represent one fifth of the total market capitalisation of the index.
Moreover, all five are technology-oriented companies which are being propelled by long-term social and economic trends set in motion by the pandemic – and hence the impact of these companies is only likely to grow. This creates an issue for investors, as increased concentration results in greater risk.
It also raises the stakes for politicians and regulators who may be concerned about the dominance of these five ‘Big Tech’ companies in their respective markets. As political and regulatory action represents the biggest threat to Big Tech’s continued success, policymakers will be aware that any action against them could have significant repercussions for investors – potentially even leading to a stock market crash. Perhaps, for this reason, these Big Tech companies have now become ‘too big to fail’.

