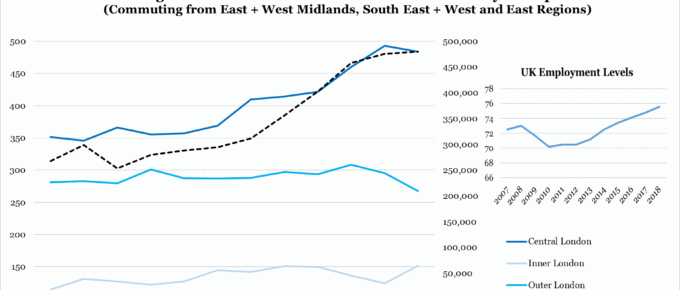
London had the least affordable housing, with a ratio of 11.98, meaning workers required nearly 12 times their annual salary to purchase a home. Although some of the highest wages are concentrated in London…
Chart of the Week: Week 17, 2016: GDP Growth by Sector
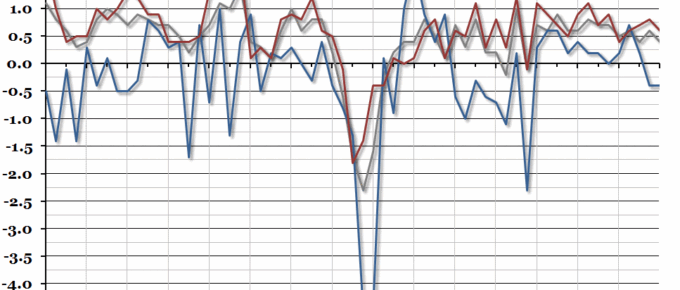
The preliminary estimate of first quarter GDP growth was released this morning, and it showed that growth had slowed at the beginning of this year to 0.4% (from 0.6% at the end of 2015).
Chart of the Week: Week 6, 2016: UK Production
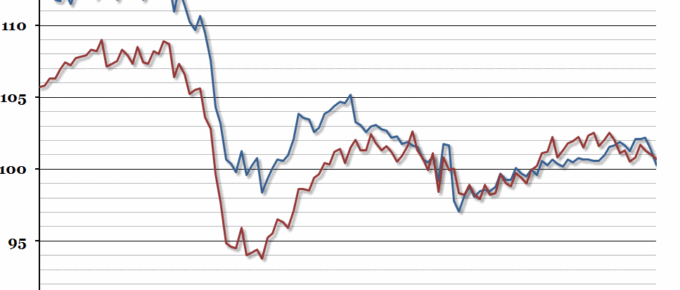
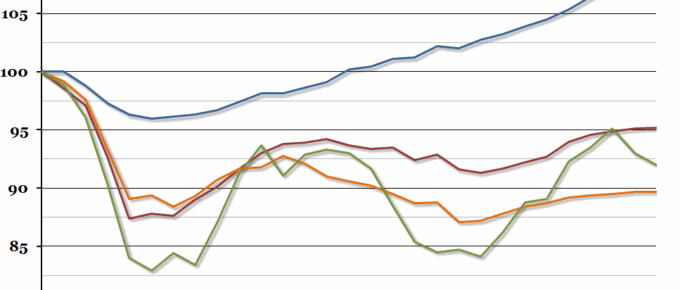
This morning the UK’s production index for the end of 2015 was released, and it showed that the poor end to the year left the UK’s production sector, and in particular manufacturing, smaller than at the end of 2014.
Chart of the Week: Week 22, 2015: UK GDP Growth by Sector
Contrary to most economists’ expectations, the overall growth rate in the first quarter of this year remained unchanged last week, at a disappointing 0.3% (most people had expected it to be revised upwards).
Chart of the Week: Week 6, 2015: UK Production Index
Yesterday, the Office for National Statistics released the index of the output for the production industries in December 2014.
Chart of the Week: Week 22, 2014: UK GDP Growth by Sector
When the second estimate of Q1 GDP was released at the end of last week, the preliminary growth rate of 0.8% remained unchanged.

