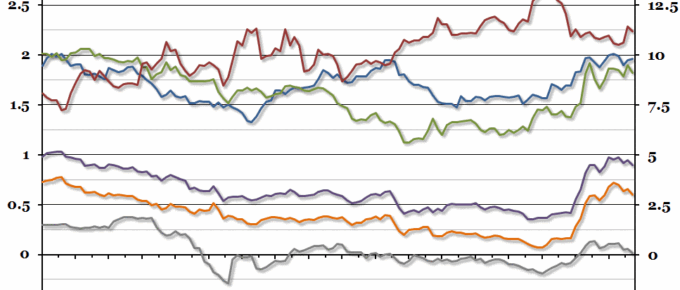
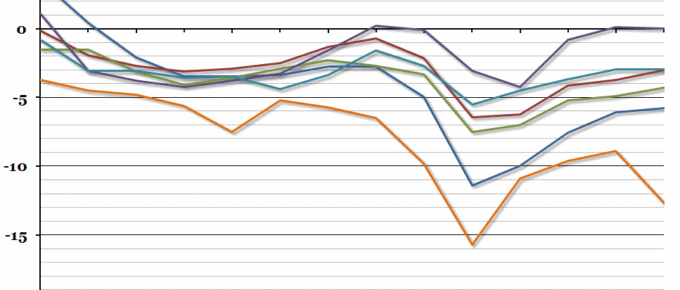
There have been some interesting movements in the European government bond markets over the past 6 months, ranging from incredible negative yields on 10 year Swiss bonds through to almost 14% yields on Greek bonds.
Chart of the Week: Week 15, 2015: IMF Growth Forecasts
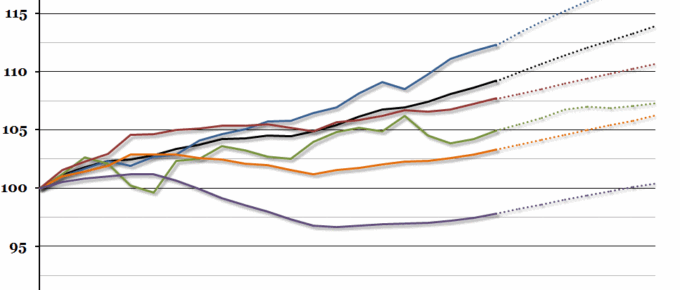
The International Monetary Fund (IMF) release their twice yearly World Economic Outlook report in April, and it contains a great deal of data and forecasts.
Chart of the Week: Week 3, 2015: Full Employment
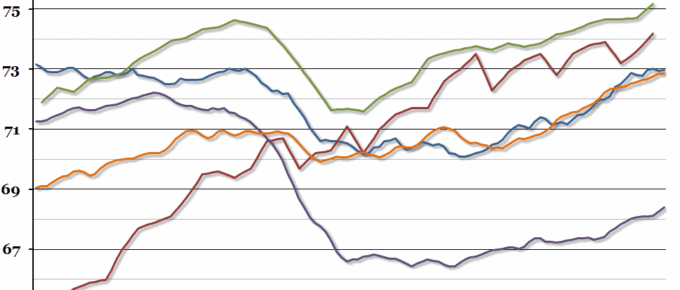
David Cameron set out his aims for “full employment” this week, defining it as having a higher employment rate than other developed economies.
Chart of the Week: Week 1, 2015: European Unemployment
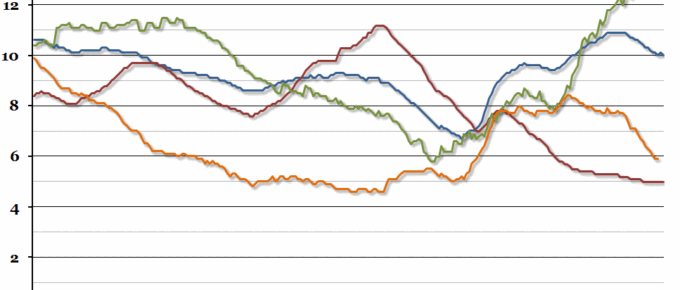
EU unemployment figures released today highlighted the disparity between countries within Europe, as Germany posted a record low rate and Italy a record high.
Chart of the Week: Week 39, 2014: European Government Deficits
UK public sector finances were released yesterday, showing that the deficit so far this financial year is higher than last year.
Chart of the Week: Week 18, 2014: International Post-Recession Recovery
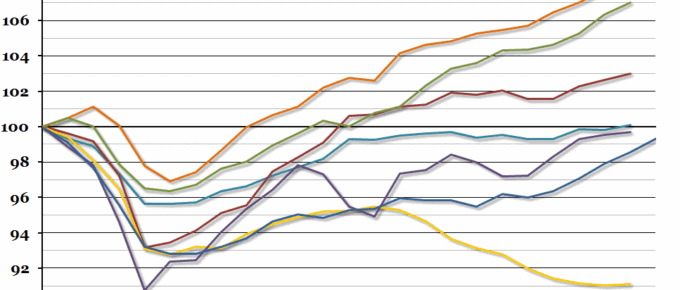
A preliminary estimate of Q1 GDP released by the Office for National Statistics yesterday suggested quarter on quarter growth of around 0.8%.

