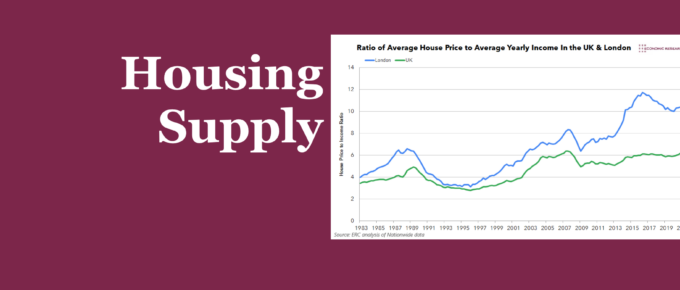
In this chart, we explore the extent to which the UK housing crisis is a matter of supply, and how recent plans – concerned with increasing housing density in urban areas – might resolve this.
Chart of the Week
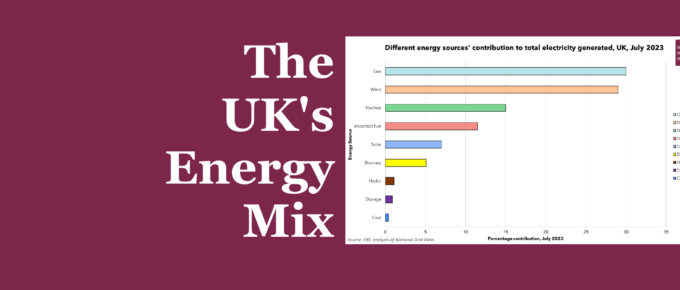
With energy as a key component in the heightened cost of living, the ongoing conflict in Europe has highlighted the importance of energy self-sufficiency; as new oil and gas licences cast doubt upon the UK’s commitment to net zero emissions by 2050.
Chart of the Week
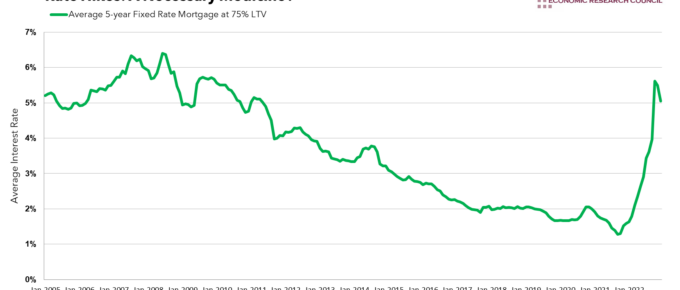
Summary As UK’s bank rate hits a 13-year high, its impact reverberates through the economy, with disposable incomes shrinking and inflation spiralling. Amidst this, debates rage on the true culprits behind soaring inflation. We present an incisive analysis of the UK’s economic landscape, from the plight of mortgagors and renters to the potential pitfalls of […]
Chart of the Week
This week, we delve into the impact of changes in the price of different energy-intensity goods and services on the 12-month CPI inflation rate in the UK, illustrating the growing effect of energy-intensive components on inflation rates.
Chart of the Week
The labour market is changing. Whilst automation is a significant driver, it affects industries in different ways, and is not the only factor at play.
Chart of the Week
As we near the deadline for Clash of the Titans entries, we thought we’d provide you with a sense of the economic outlook moving through 2023. The chart displays the 2023 GDP forecasts of several institutions. These convey a sense of pessimism, with the average forecast being -0.76%. Consensus suggests the UK will experience a […]


