
The earnings gap between the advantaged and disadvantaged is often explained using educational attainment, though this week’s chart questions whether more is at play.
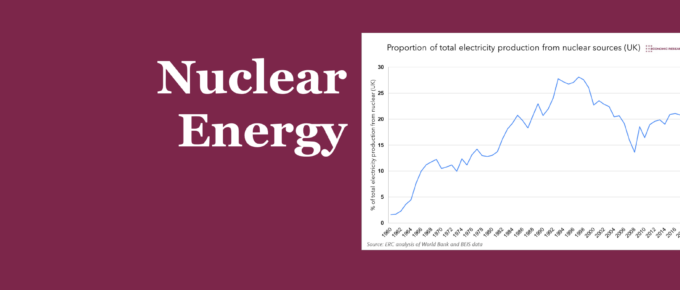
Chart of the Week
As issues such as sustainability and energy independence face the country, perhaps the energy mix requires a review.
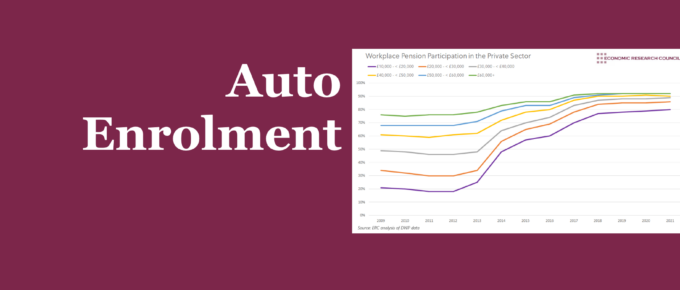
Chart of the Week
Auto-enrolment had the foresight to address a problem that forthcoming generations will experience, whilst simultaneously easing the burden of the future state. This week’s chart assesses its impact, as well as potential improvements we may see in the future.
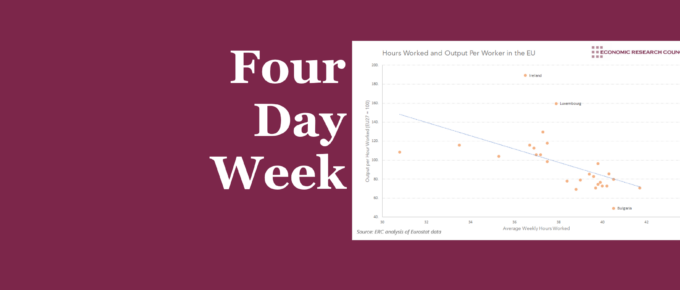
Chart of the Week
This week’s chart shows a strong negative correlation between hours worked and output per hour. Nevertheless, underlying factors seem to be driving this effect in at least some of the countries mentioned.
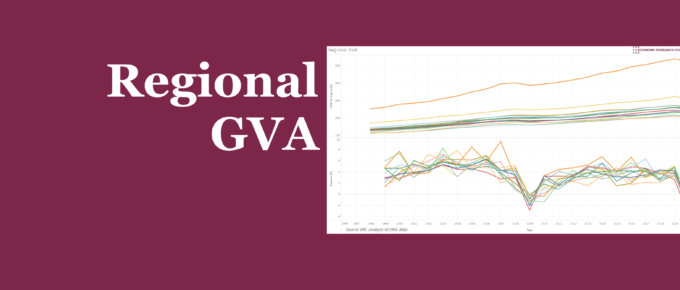
Chart of the Week
While it has long been understood that economic activity has been skewed towards London and the South East, the analysis helps us to understand the dynamics of the within-region inequality in output.
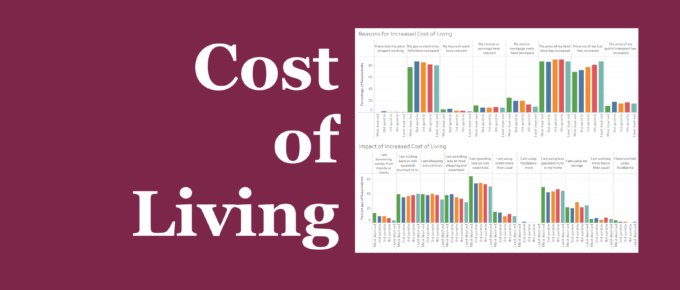
Chart of the Week
These statistics combine to emphasise the mantra that many people are choosing between “heating and eating”.