Summary
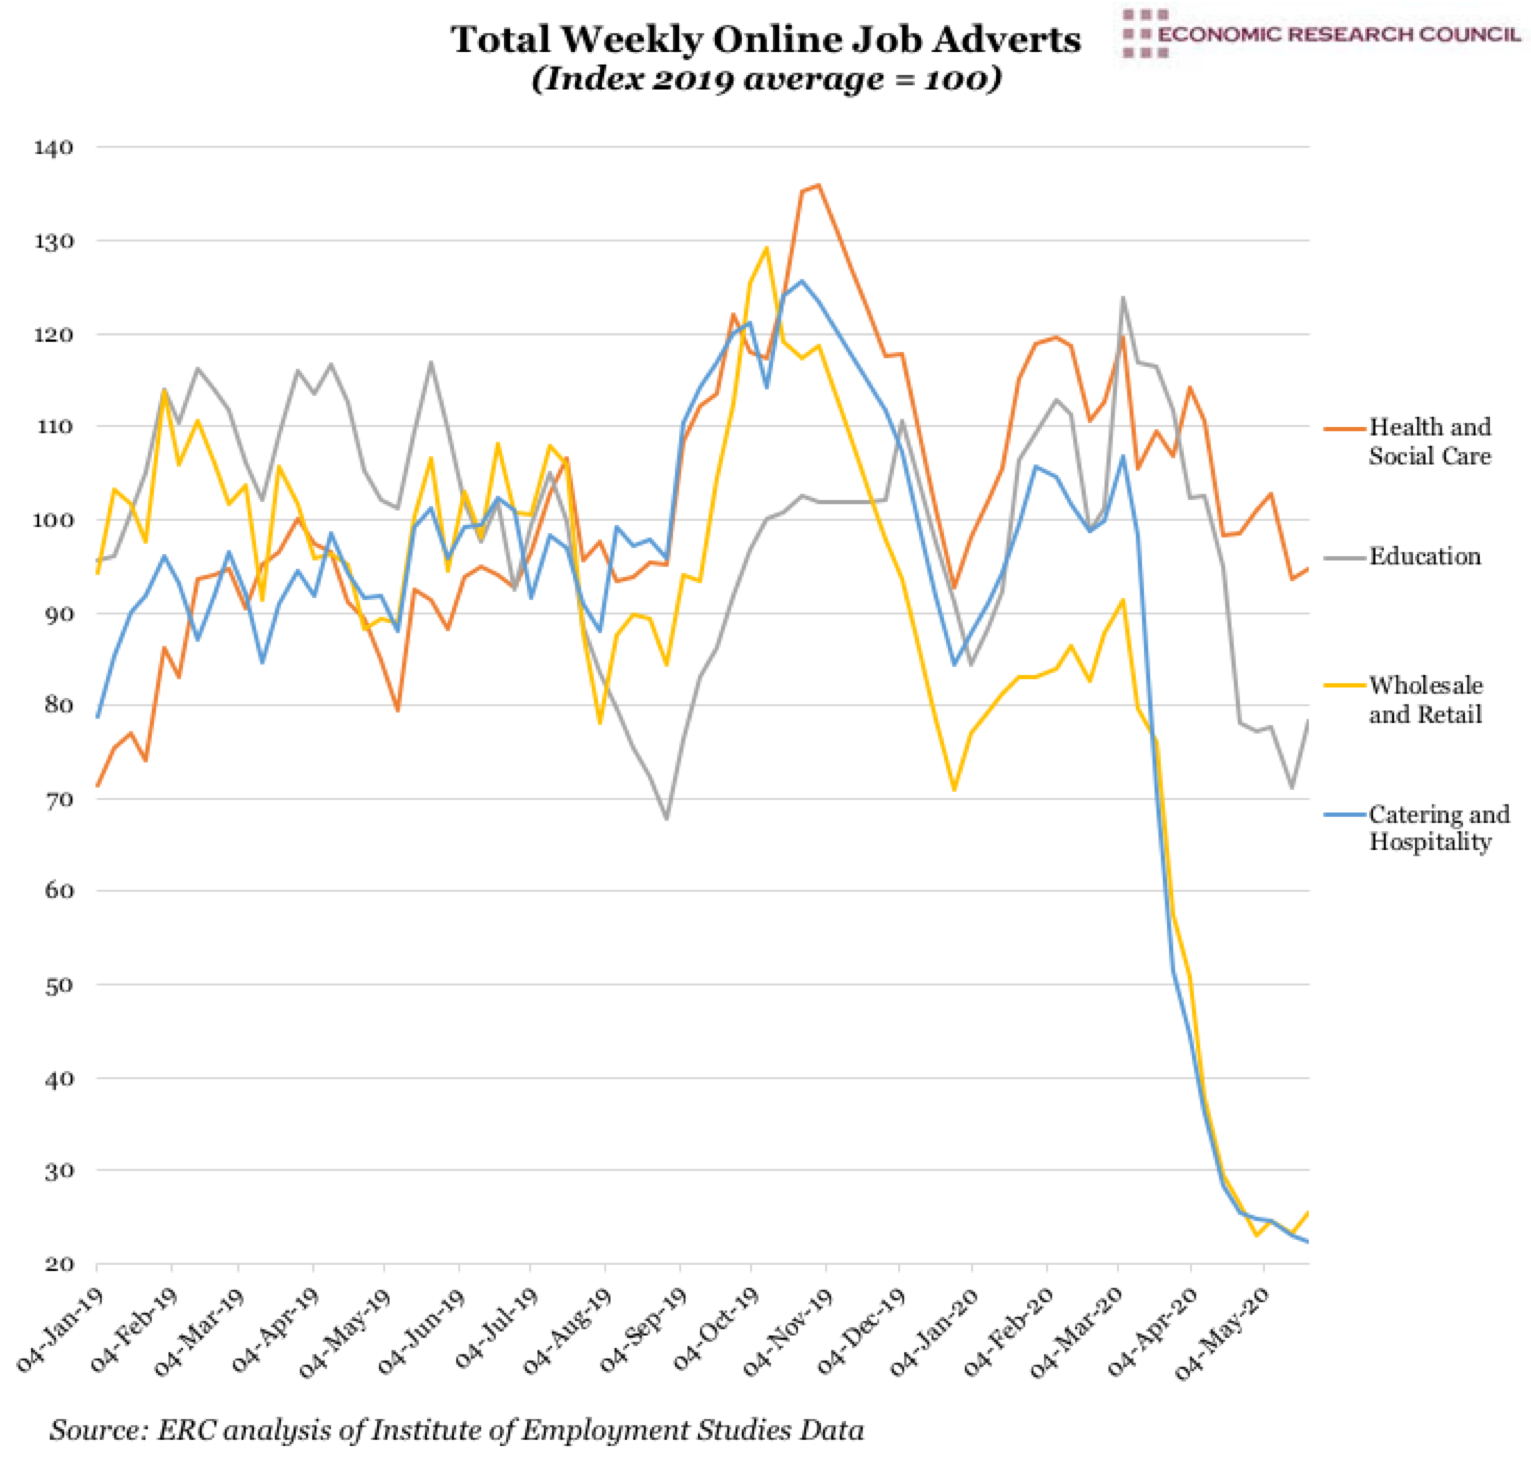
On 15th March, some 820 thousand vacancies were listed, plummeting to 316 thousand on 17th May. Over the last week alone, a further reduction of 13 thousand vacancies (4%) across all sectors has occurred. The chart displays what has become familiar in the last few months but it allows for like-for-like comparison with 2019, throughout which the number of online vacancies remained relatively constant. In March 2020, a rapid decline began across all industries, although it began to level off at approximately 43% of the 2019 average from the beginning of May. Of those sectors charted, worst hit was catering/hospitality and wholesale/retail which stabilised at a fifth and a quarter of 2019 levels respectively. Looking more widely at other sectors, HR/Recruitment has predictably been affected dramatically although the largest fall has been in the IT sector, perhaps surprising given many organisations’ scramble either to create from scratch a digital offering or move entire workforces online. Despite the suspension of non-essential health services, health and social care recruitment appears to have been relatively unscathed in the pandemic.
What does the chart show?
The chart shows the change in the number of online vacancies available in the UK since the start of 2020, with the last of entries on 22nd May 2020. The vacancy data originates from the Institute of Employment Studies, who have drawn the detail from the online platform Adzuna (which compiles the overwhelming majority of all advertised roles from thousands of external sites). The trends are displayed against an index of the 2019 average vacancy levels, i.e. the further below 100 the vacancy levels drop the more profound the contraction in vacancies, and vice versa. The data has been collected on a weekly basis but not always the same day, and some early weeks are missing so their values have been deduced via linear interpolation.
Why is the chart interesting?
Within the data we find some interesting variations. Regions of the UK have been differently affected; spanning from 1.2% contraction in vacancies in the East of England to 6.6% in Wales. Northern Ireland has experienced the smallest reduction, perhaps a reflection of the high proportion of public sector employment in the region. In London, there has been a reduction in vacancies between early March and the end of May of just under two thirds compared to 2019, or 127 thousand fewer jobs.
Reported by Bloomberg, Laura Gardiner, research director at the Resolution Foundation pointed out that young people graduating into an economic downturn suffer professionally for as long as 8 years. Those in lower-earning jobs offering £15-£25 thousand per annum (less than London Living Wage) are worst affected. Higher paid jobs’ greater likeliness to be conducted from home is partly reflected in the far lower reduction in available positions.
The number of those claiming unemployment benefits has risen by 70% between March and April- a rise that took 8 months following the 2008 recession. By mid-April, there were 4.5 claimants for each available vacancy, a 188% increase on the March figure (1.5), illustrating the scale of the economic challenge ahead. Again we see regional variation in the unemployment to vacancy ratio, with London at 2.4 jobless to each available role, Wales and Scotland at 10, with Northern Ireland at 17. With the wholly unequal outcomes with regard to income, job security and employment, the data does little to substantiate the notion that we are ‘all in this together’.

