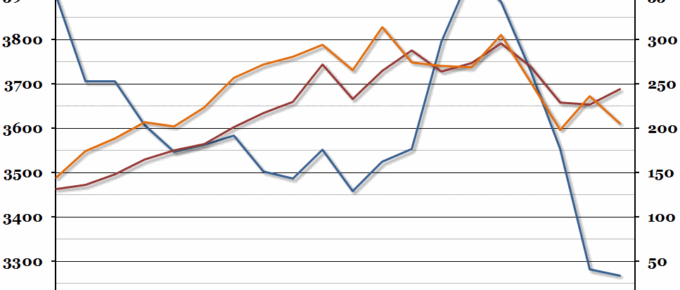
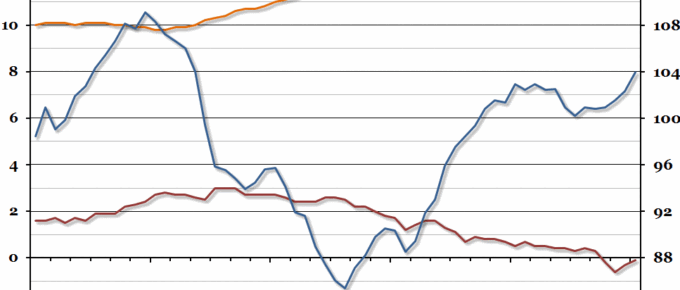
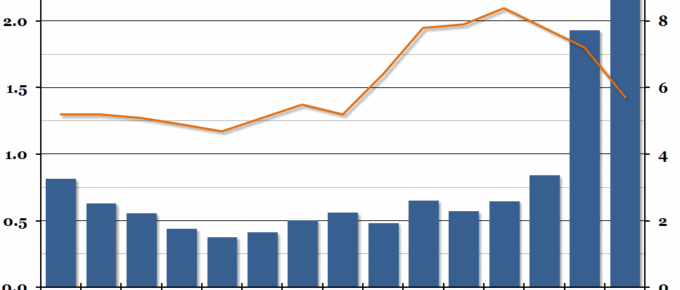
The annual study from the ONS on workless households in the UK was released yesterday, and it showed a mixed picture with total workless households continuing to fall but the number of households where nobody has ever worked growing.
Chart of the Week: Week 31, 2015: US and UK Recoveries
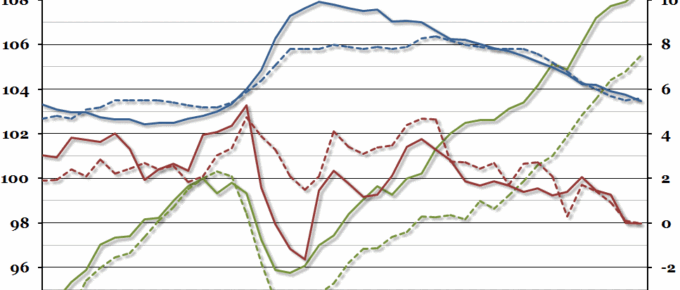
Last week, we compared the latest UK recession and recovery to historical recessions. This week, we’re comparing the UK recovery to that of the US, where despite first quarter growth problems, the recovery from the recession looks strong.
Chart of the Week: Week 18, 2015: EU Unemployment
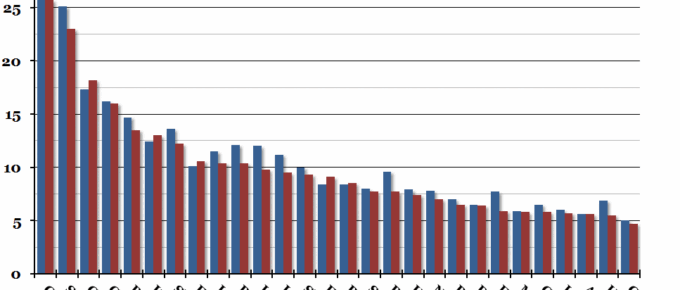
Eurostat released the latest unemployment figures for the EU at the end of last week, and the headline rate remained at 9.8% for the whole of the first quarter of this year (down from 10.4% in March 2014).
Chart of the Week: Week 16, 2015: Duration of Unemployment
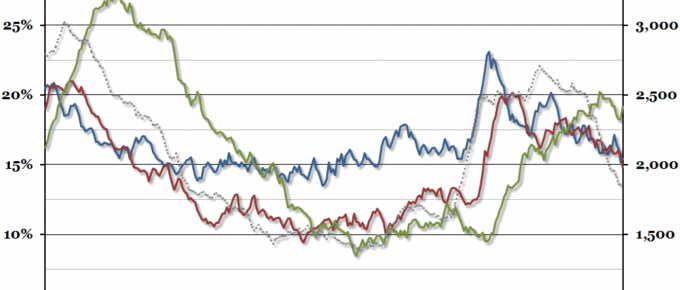
The UK labour market statistics released at the end of last week reported continued improvement.
Chart of the Week: Week 13, 2015: The Eurozone Recovery
There has been a lot of new data released this week on the Euro Area, and all of it has been positive; unemployment continues to fall (slowly), inflation is back up to closer to 0%, and economic confidence is at its highest since 2011.
Chart of the Week: Week 8, 2015: Zero Hour Contracts
The Office for National Statistics published their annual survey of “Zero Hour Contracts” this morning, which suggested that the number of such contracts had grown to 697,000 in 2014, or 2.26% of all employees.

