Michael Mackenzie has been markets editor of the Financial Times since January 2015…
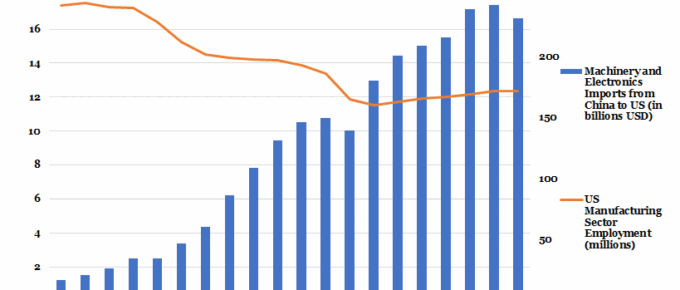
Chart of the Week: Week 28, 2018: Imports of Machinery and Electronics from China to US vs US Employment in the Manufacturing Sector
Imports from China into the USA have increased more than sixfold in the last twenty years, with the US trade deficit with China currently at $336 billion. ‘Made in China 2025’, the Chinese government drive to dominate the global market in 10 sectors…
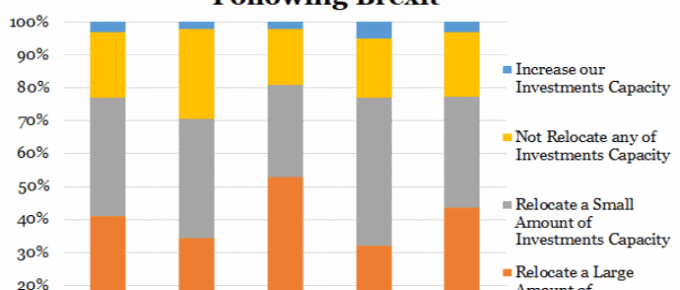
Chart of the Week: Eurozone Companies’ Plans to Withdraw UK Investment
The chart shows a very pessimistic view of investment in the UK as a result of Brexit. On average, over three-quarters of companies headquartered in the displayed nations have stated their intention to move at least some of their investments out of the UK as a result of Brexit.
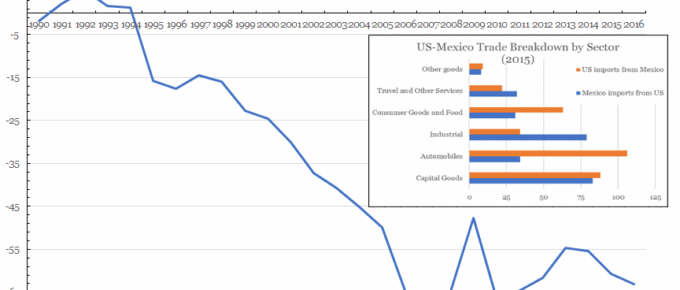
Chart of the Week: Week 5, 2017: US Trade with Mexico
The chart shows that the US has been in trade deficit with Mexico since Clinton came to power, with George Bush Jnr presiding over the period with the largest deficit increase; around $29 billion.
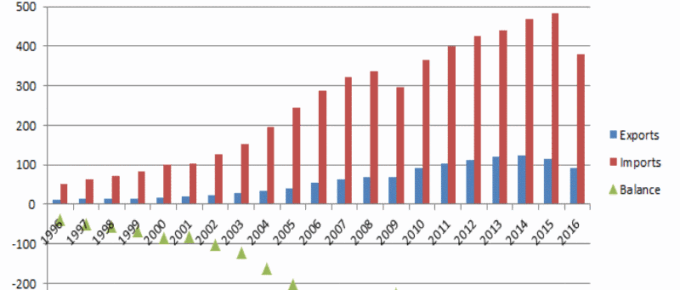
Chart of the Week: Week 50, 2016: US Trade in Goods with China
The chart demonstrates the extent to which the two countries’ economies are intertwined and the enormity of the US trade deficit with China, which has only increased in the last two decades.
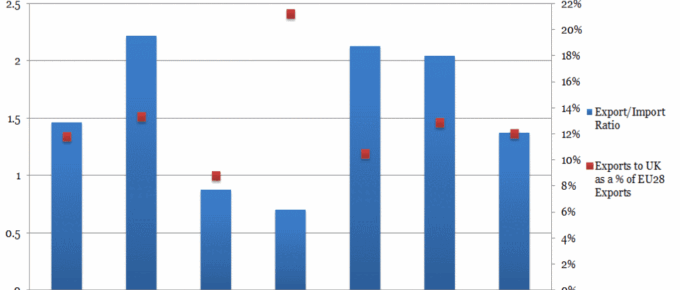
Chart of the Week; Week 41, 2016: EU Nations’ Reliance on Trade with the UK
The chart shows some aspect of each nation’s position on trade with the UK in the run up to Article 50 negotiations with access to the single market being the key issue.


