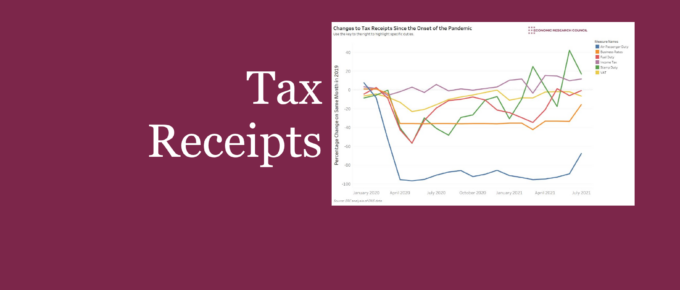
Tax receipts were pummelled due to lower economic activity associated with the COVID pandemic. This chart highlights the development of notable duties that together help to highlight the effect of the pandemic on government income. Use the interactive chart to focus on specific duties.
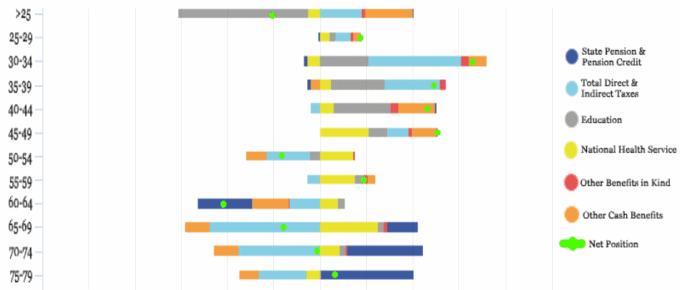
Chart of the Week: Week 32, 2018: Households, Taxes and Benefits over the Last Decade
Following the 2010 election, Labour lost power to a Conservative -Liberal Democrat coalition, which introduced sweeping austerity legislation. Described by the FT at the time as the’ most drastic…in living memory’, the budget cuts amounted to £81 billion over…
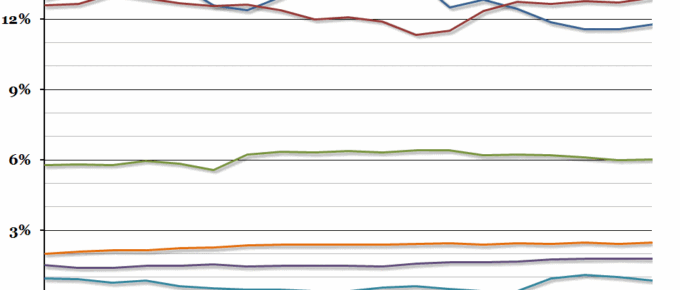
Chart of the Week: Week 25, 2016: UK Government Revenue
Yesterday, the Office for National Statistics released updated figures for the UK government finances in the financial year 2015/16.
December 2015
Apart from the normal and incalculable unknown unknowns, a possible debt explosion or a Putin play, 2016 is likely to see a steady improvement in the economic environment. 2 to 3% growth with near zero inflation is really quite benign. With Governments, albeit at glacial speed…
March 2014
With spring in the air, we should be seeing economies improve, albeit at different rates. It is certainly likely that those in work and businesses will put the foot on the accelerator…..
December 2012
Politically led witch-hunts of legitimate businesses that are compliant with law but don’t seem to be paying enough tax is undermining the reason why so many businesses come to the UK or are successful in the UK. This is a very dangerous trend, particularly from a Conservative Government…


