London had the least affordable housing, with a ratio of 11.98, meaning workers required nearly 12 times their annual salary to purchase a home. Although some of the highest wages are concentrated in London…
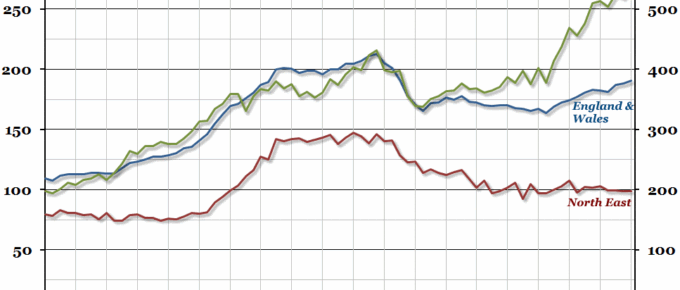
Chart of the Week: Week 22, 2016: Average House Prices
The Land Registry’s data for the first quarter of the year came out recently, showing a 6.5% year-on-year growth rate in nominal prices for England and Wales, while in London, the equivalent rate was 13.8%.
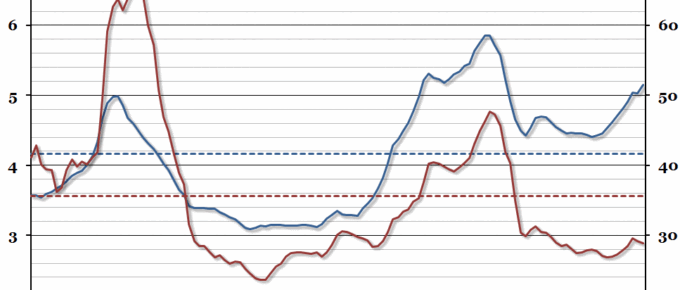
Chart of the Week: Week 28, 2015: UK Housing Affordability
In this year’s edition of our annual chart on housing affordability in the UK (you can see last year’s chart here), the average house price has continued to grow to more than five times earnings, while mortgage affordability has started to improve.


