This week marks the fifth anniversary of the Economic Research Council’s Chart of the Week.
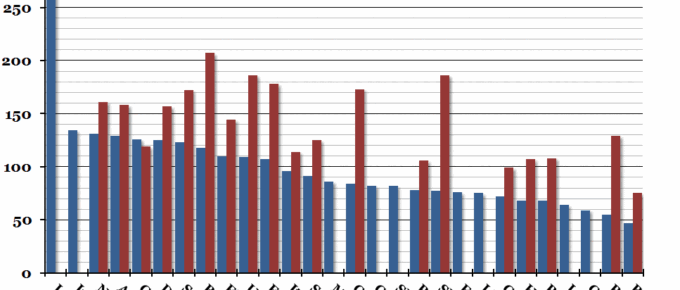
Chart of the Week: Week 9, 2016: EU GDP Per Capita
At the end of last week, Eurostat released a report on regional GDP per capita across the EU.
Chart of the Week: Week 42, 2015: EU Government Finances
Eurostat announced their updated statistics for European government finances this morning, and the headline figure showed that across the EU, the average deficit improved from 3.3% to 3%.
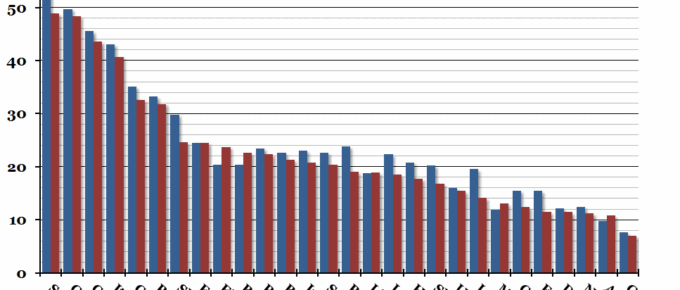
Chart of the Week: Week 39, 2015: EU Youth Unemployment
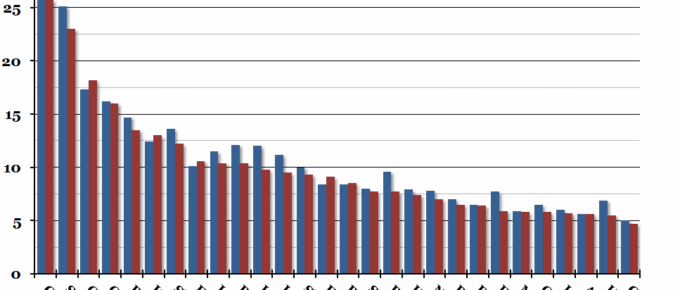
European unemployment figures were released by Eurostat this morning, and showed a continuation of the downward trend in the aggregate EU unemployment rate.
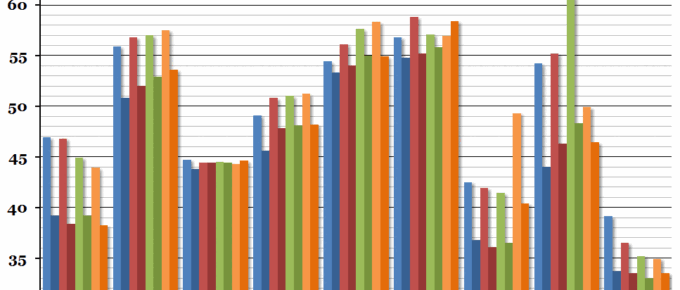
Chart of the Week: Week 27, 2015: EU Government Spending
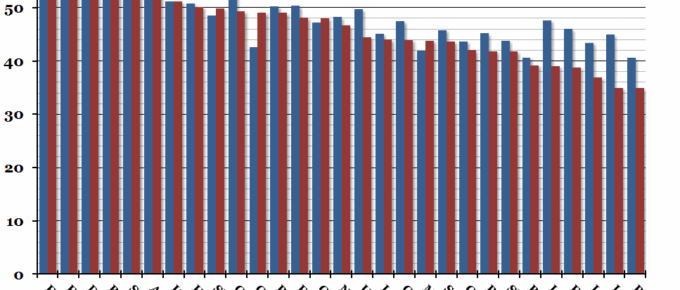
With the UK Budget due later today, this week’s chart compares total government spending, as a percentage of GDP, across all the EU countries.
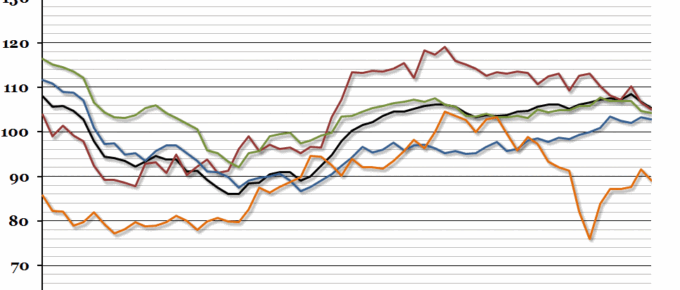
Chart of the Week: Week 18, 2015: EU Unemployment
Eurostat released the latest unemployment figures for the EU at the end of last week, and the headline rate remained at 9.8% for the whole of the first quarter of this year (down from 10.4% in March 2014).

