Wednesday 12th June 2019
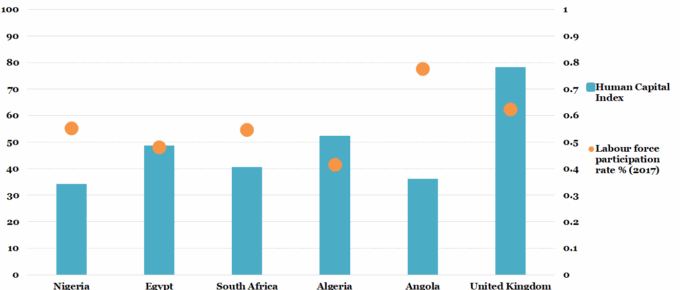
Chart of the Week: On Human Capital in Africa
56% of children born today will lose over half of their potential lifetime earnings due to…
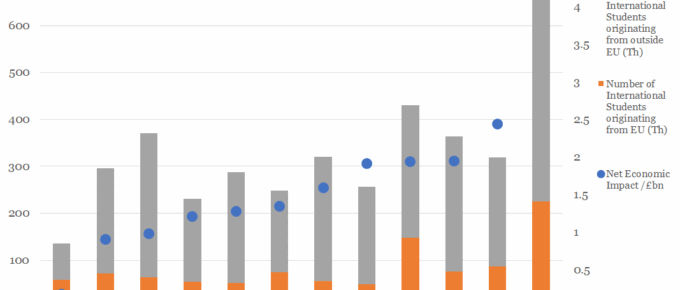
Chart of the Week: Week 2, 2018: International Students’ Economic Impact by Region
The chart shows the economic impact of the 2015/16 cohort of international students, who on average, contribute £1.7bn to each region displayed. Of the international students in this cohort, an average of 25% originate…
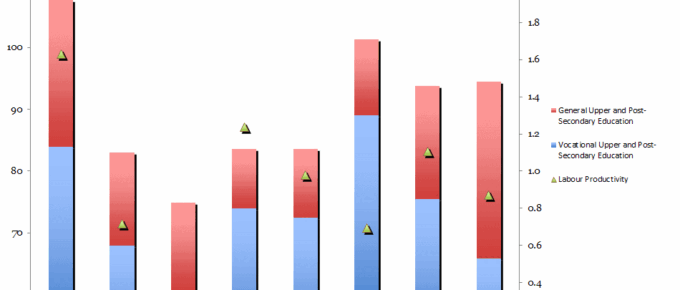
Chart of the Week: Week 44, 2016: Government Spending on Education v.s. Labour Productivity
The chart shows that the UK, when compared to other EU countries with strong economies, has one of the lowest levels of spending on vocational education as a percentage of GDP (under 1.5%).
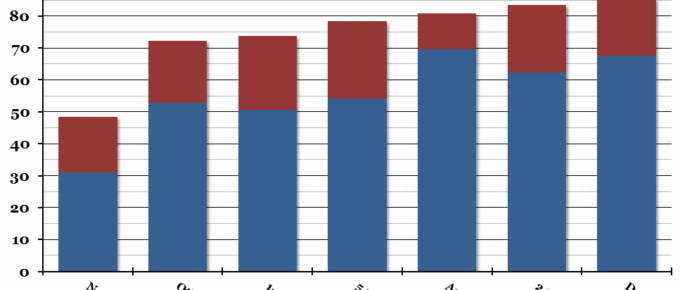
Chart of the Week: Week 25, 2014: Employment Levels by Qualification
The Office for National Statistics released further analysis of the 2011 census results this morning, looking at the link between employment and qualifications.


