In the first webinar of our Econ Club programme, Ben Gardiner joined us to discuss issues around levelling up. You can find resources linked to this webinar here.
Latest Blogposts
Levelling Up – Ben Gardiner – Resources
Levelling Up – Ben Gardiner
Economic Policy Choices – Sir Charles Bean
Sir Charles Bean joined us for our 2nd Econ Club webinar to discuss issues surrounding the economic policy choices facing the UK. You can find resources linked to this webinar here.
Chart of the Week
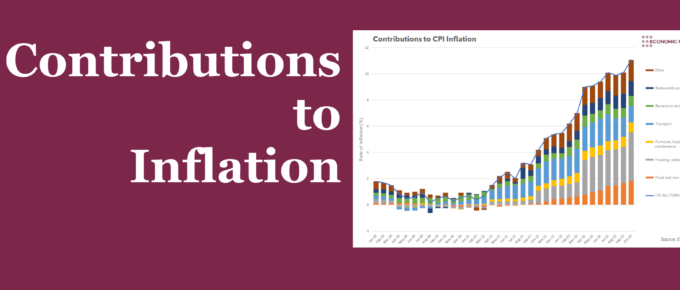
Summary October’s headline inflation rate of 11.1% was largely led by two groups: Housing, water, electricity, gas and other fuels, and Food. This week’s chart assesses the drivers behind these groups, to judge their likely trajectory into 2023. What does the chart show? The chart shows the contribution to the overall year-on-year rate of inflation […]
Chart of the Week
Whilst high inflation has been with us since 2021, the economic atmosphere has certainly changed through the year. This week’s chart assesses Bank Rate expectations over time to see what they tell us about the economy.


