Summary
The proportion of young people not in education, employment, or training (NEET) has fallen steadily and in line with unemployment since the aftermath of the financial crisis. The turn of the year brought a rapid reduction in NEETs relative to general unemployment. Higher education has had a significant impact on this figure. Whilst employment in 16-24 year olds seems to play a part, a broader assessment presents concerning conclusions.
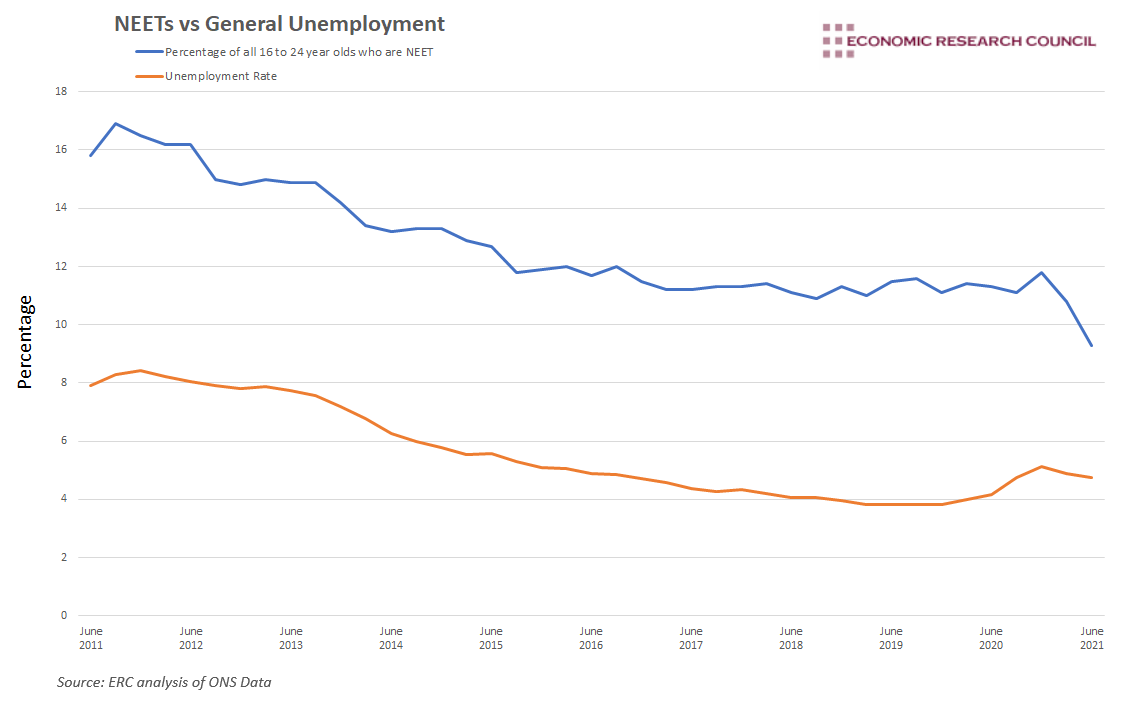
What does the chart show?
The chart displays the percentage of people aged 16 to 24 who were not in education, employment or training (NEET) in the last 10 years, shown in blue. In addition to this the unemployment rate, shown in orange, is presented for comparison. The data has been gathered by the ONS from the Labour Force Survey.
Why is the chart interesting?
With the Institute of Employment Studies reporting that low paid workers were twice as likely to lose their job during the pandemic compared to higher paid employees, and median earnings for 18 to 21 year olds amounting to just £11,450 per annum, young people have faced an acute risk of unemployment through the pandemic.
Indeed the picture seemed bleak as the NEET rate increased to 11.8% in 2020, its highest rate since 2015. Despite this, it fell sharply into Q2 2021, registering its lowest ever rate of 9.3%. At the same time, the unemployment rate fell from 5.1% to 4.7%.
Beyond these figures, the chart shows a clear correlation, as expected, between the proportion of NEETs and the unemployment rate over time. In the aftermath of the financial crisis, unemployment fell steadily, before a rise to over 5% in 2020, a level it had not seen since 2016. Successive waves of COVID and the accompanying lockdown restrictions certainly played their part, though the magnitude of the rise was significantly dampened through much discussed government policy. Whilst unemployment has since fallen, the reduction in NEETs has been more pronounced, reflecting the phenomena of youth unemployment acting more sensitively, in both directions, compared to general unemployment. Whilst the chart reflects this quirk, which is attributable to lower wages and younger people having lower job security, the reduction in NEETs vs general unemployment was particularly stark since 2020, with both the number and proportion of NEETs falling to record lows in June 2021.
Higher education explains much of this. After a dip in applicants in 2012, owing to the increase in tuition fees, applications have grown relatively steadily, with the exception of a small dip between 2017 and 2018. Last year saw the greatest ever demand for higher education places, with 729,000 applicants and 570,000 acceptances. The reduction in job opportunities early in the pandemic, coupled with a lack of gap year options seems to have driven young people towards higher education.
Apprenticeships, on the other hand, have not shown such strong results. Just over 2 million apprenticeships were started between 2015 and 2020, missing the government’s target of 3 million. The last full academic year before COVID (2019/20) saw 393,000 starts compared to 509,000 three years prior. The pandemic has only served to exacerbate this trend, with 323,000 starts occurring in 2019/20.
Whilst on the surface the chart offers hope for the employment prospects of young people, further analysis presents concerns. Despite the number of unemployed 16-24 year olds falling by 27,000 in June 2021 compared to the year before, the number of 18-24 year olds claiming unemployment benefits remains 75% above pre-pandemic levels. The initial increase in claimants occurred partly due to some employed people becoming eligible for universal credit. Such a large number of young people still claiming, despite some resumption of economic activity, directly contradicts the story portrayed by the reduction in NEETs by the chart and instead highlights their precarious existence whilst having jobs.
The reduction in NEETs in 2021 has largely been a result of increased higher education participation. Whilst unemployment levels in 16-24 year olds are falling and thus contributing to the reduction in NEETs, a broader assessment of the job market is needed to understand the plight of young people.
By David Dike


