Summary
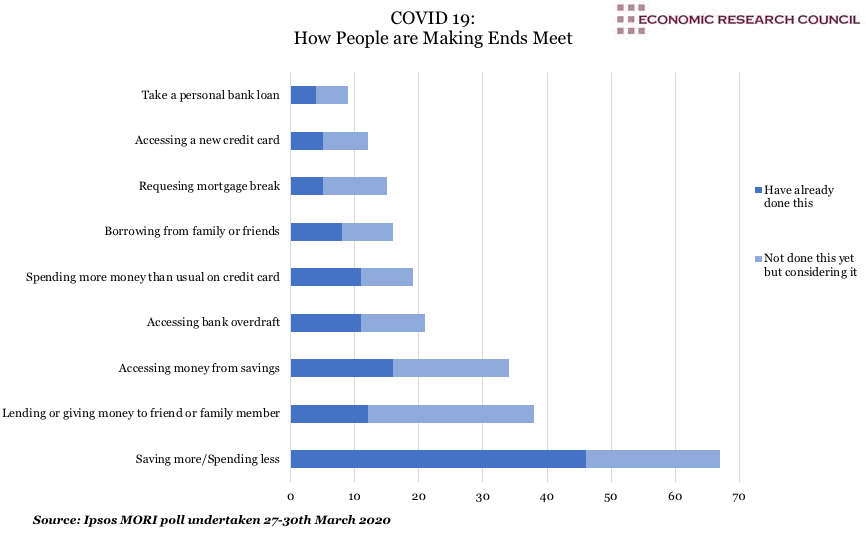
The chart shows the relatively swift and destructive impact of COVID 19 on personal finances. As the chief executive of the polling organisation states ‘Despite significant government financial support for businesses and households, we are still starting to see a considerable increase in the debt burden for UK families and this will surely only get more marked if the epidemic continues for many months .’. Their survey shows that by the end of March, almost half (46%) of all Britons are tightening their belts as a result of COVID 19.
Younger respondents were more likely to resort to accessing credit via overdrafts, loans or dipping into savings. 16% of respondents are using their savings, and almost fifth are considering this. Again, one quarter of these are young people, whereas only 13% of 35 to 54 year olds and 11% of 55 to 75 year olds said the same. Where overdraft use is concerned, 11% overall are using them as a result of the crisis, but when the young (under 35) and old (55-75) are compared, the figures are 18% and 3% respectively.
In terms of accessing more formal credit, some 11% of those aged 18 to 34 have taken out bank loans, whereas only 1% of those over 35 has. For accessing new credit cards, 11% of the younger cohort have resorted to this compared to under 2% of older respondents. Surprisingly, the cohort who appear to be most stretched financially are also the cohort most likely to be generous in financially supporting others. While 8% of overall respondents report having already given or loaned funds to friends or relatives, for young people the figure is nearly a fifth (18%). Indeed, over a quarter of young respondents said they were considering giving or loaning money versus under 14% of 35 to 75 year olds.
What does the Chart show?
The chart displays the results of a survey conducted by Ipsos MORI of 1072 representative British adults. The survey was conducted online between March 27th and 30th. The data was weighted to match the profile of the population. The survey question was ‘Thinking about your current financial situation, have you done, or are you considering doing, any of the following?’ with certain questions having a ‘not applicable’ option.
Why is the chart interesting?
The pandemic is likely to further widen the gap between low and higher-income earners; low-income workers are more likely to be employed in industries and on contracts that are more precarious and more negatively impacted by the lockdown upheaval, whereas middle and higher-income workers are more likely to be employed in professional roles where accessing furlough schemes and working from home are more feasible. For the middle classes, with far higher discretionary income, the lockdown can provide opportunity to save money via the closure of many establishments where a reasonable proportion of their disposable income is usually spent. For low-income people, not only is there lower scope for saving their comparatively smaller discretionary income, but the impact of the pandemic is hitting their employers hardest.
The intergenerational differences in the effect of the pandemic are becoming clearer. Although the health risks posed by COVID 19 disproportionately affect older members of society, they are better protected economically (much like in the 2008 recession). It is interesting that the young appear most affected and yet most likely to offer financial assistance to others. This may be a product of a portion of the cohort having professional jobs and fewer dependents, versus another portion who are more likely than the old to be in precarious employment.
In the UK, fewer young people live in large intergenerational extended family homes compared to Europe (particularly the southern countries) and it is worth contemplating how this will likely affect the economic recovery after the pandemic. Extended family structures in European nations are likely to offer support both financial and in kind to each other at a wider scale than in the UK. In the UK, it seems that the young and the economically vulnerable may well be likely to access more formal finance, such as loans and credit cards, with their spending likely to result in more taxable activity driving GDP growth.
The OECD has suggested that the global economy will potentially suffer for years to come, as government debt soars and business and consumer confidence are eroded.1 A sharp drop in property prices, while possibly good news for prospective buyers, could drag hundreds of thousands into negative equity. Savers and investors face significant losses, with potentially serious consequences for the future retirement income of workers with defined contribution schemes. Those already retired but reliant on dividend and savings income could also be badly hit by the current crisis.
Another effect of the likely global downturn in the coming years, is low business and consumer confidence. Property prices may fall, pushing many into negative equity and those on DC pensions or dependant on investments and savings are meeting profound losses. Though those in the West must appreciate the dire conditions faced by those in nations with no safety net, millions of Americans find themselves jobless and Universal Credit applications in the UK have soared by one million: indeed, the welfare bills of government are mounting to unprecedented levels. The IFS recently reported that a UK government deficit of £200 billion was not unlikely. Looking ahead to how governments are likely to strive to reduce deficits in the future, lessons from 2008 must be learned.
Following the austerity measures enacted after the last recession, the government sought to protect the incomes of the older generations at the expense, some claim, of protection of the younger. For example, between 2010 and 2016, the IFS reported that state pension value rose 22.2% compared to wage growth of a third the level (7.6%). This was cited as a result of policy decisions that favoured pensions spending over welfare benefits for those in work, with additional injections into pension spending of approximately £6 billion in 2015-2016 alone above rises from indexing earnings. Where welfare benefits for those of working age were frozen, benefits universal to pensioners like Winter Fuel Allowance were protected. Indeed, in 1997, state pension was 27% higher than Job Seekers Allowance, but now the figure stands at 80% higher.
Recently published research by think tank, the Social Market Foundation highlighted that working age households were more likely to be in poverty that pension age households and made policy suggestions for any austerity measures enacted following COVID 19. These included abandoning the ‘triple lock’ for a ‘double lock’ which would see pensions rise at a slower rate. The SMF research highlights ‘the social contract between generations [that] members of a good society look out for each other and are prepared to sacrifice some welfare for others. As we emerge from the crisis, older generations must uphold their part of the contract by bearing a fair proportion of future tax rises and welfare reforms.’.
There is a risk that following the shock of the pandemic and poor economic recovery, deep seated pessimism may set in for the young, who already feel that their lives will be less prosperous than their parents’.
Week 17, 2020

