Summary
Among all assumptions in macroeconomics, one of the longest-standing has been the belief that sources of national income are shared between labour and capital in proportions that remain relatively constant over time. In other terms, the share of total income in an economy paid to each of its factors does not change regardless of all other factors including relative prices or business cycle. This general consensus has been unraveling, a phenomenon which has ramifications on discourses on economic inequality. This year’s World Economic Forum received sizeable backlash, with conversations about inequality and labour rights growing increasingly prominent. While the focus of discussions often centres on the bloating of incomes of rich individuals versus a declining proportion of wealth held by the global poor, a deeper analysis of the earning potential of labour versus that of capital can offer more nuance and insight to the economic inequality problem.
What does the chart show?
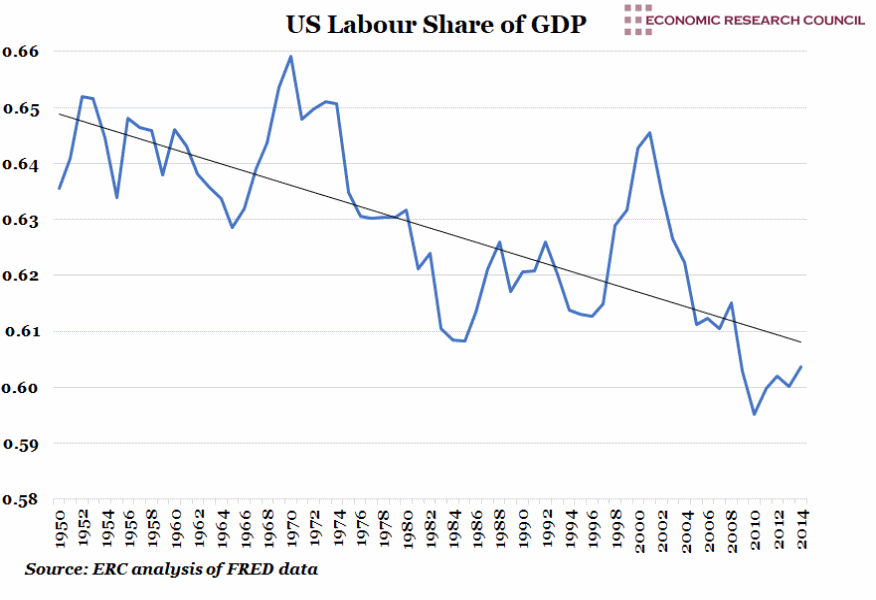
The blue line plots the share of income received by labour as a proportion of US GDP from 1950-2014. ‘Share of income’ refers to the proportion of GDP in an economy paid out to the two main factors of production; labour and capital(stock, land etc.). Using this dichotomy, the capital share and labour share of income as proportions add up to one (representing total GDP). Therefore, should one decrease, the other increases. In order to demonstrate more clearly the overall trend, a black line of best fit has been added. Although helpful, this line does obscure smaller trends in the data.
Why is the chart interesting?
This ‘natural’ and remarkable split in the shares of national income has historically been accepted as consistent. Keynes described this as ‘a bit of a miracle’ as no fundamental or easy explanation for why this trend has been observed exists. In fact, this economic theory was deemed so important that it gave rise to the first and most prominent production function able to aggregate production on an economy-wide scale, the Cobb-Douglas constant returns formula. The key aspect of this equation and its importance in macroeconomics arises from the constant nature of capital and labour shares of income, regardless of exogenous variables such as wages, capital rents and availability of labour and capital. This has widely been considered to be an accurate representation of the history of economies around the world. In the late 1920s, economist Paul Douglas used US census data to form a large-scale aggregation of the capital compensation to labour compensation ratios and found that labour and capital captured 75% and 25% of income respectively. This aggregation has since been refined to a general ratio of 2 to 1 for labour to capital. The United States Bureau of Labor Statistics produces a measure of income shares every year. The federal reserve database FRED also collects data and produces this measure for many other nations. Since Douglas, many prominent economists, including Keynes, Solow, and Kaldor have corroborated these findings and many studies continue to rely on Cobb-Douglas assumptions to underpin important economic research.
Over the past half-century, developments in the shares of income have caused much contention of these fundamental assumptions. Since the early 1980s, the US labour share of income has steadily decreased, with a notable exception of the late 1990s. This led to an overall drop of around 6 percentage points in the mean labour share. Similar trends are being exhibited around the world. We encourage readers to review the data from other nations here. This decline has large consequences in terms of the debate surrounding economic inequality and for economics as a whole. It contradicts many assumptions and has led many to seek to explain these deviations from the longstanding trend which has held since the 1850s. A large issue facing the movement to combat global economic inequality is that inequality is not a self-evident vice. When the total sizes of national economies are growing, many contend this is good for everyone, not just those at the top. Particularly in the developing world, economic growth has not just created many oligarchs, but lifted exponentially more out of the depths of poverty and hunger. While this is certainly true, analysis of the labour share of income provides a clearer picture of the detriments of increasing inequality. The labour share represents the proportion of total GDP that wage and salary workers take home. The overwhelming majority of workers do not receive income from capital rents, which constitutes the other proportional income share, the capital share. So when the labour share is on a 50 year overall decline, it can be concluded that real household wealth for the vast majority of workers is not increasing, regardless of economic expansion, such as during upturns in the business cycle. In other terms, nomatter whether the proverbial pie increases in size; workers still taking home the same sized slice. When taken in real terms, this means that their incomes are decreasing. Economic growth is no longer self-evident to people who feel less and less of its benefits. Ultimately, this is a negative development for economies that rely on gradually increasing nominal money supplies and the maintenance of a constant real standard of living. When households can no longer afford to borrow, increase spending, pay increasing tax burdens even when the economy is expanding, the future looks somewhat gloomy.
Neoclassical explanations of the decrease in the labour income share lay the blame on skill-biased technological change or technology that increases the returns to capital vis-à-vis labour (which has also become relatively cheaper). As productivity increases and capital becomes relatively more productive than labour, two consequences emerge. Firstly, it becomes cheaper to replace workers with capital goods and secondly, workers then produce much more in the same time with more productive capital. When workers are not compensated for these increases in productivity and when capital productivity growth itself outpaces the growth in labour productivity, the labour share of income is eroded. In The Decline of the U.S. Labor Share, Elsby, Hobijn, and Sahin examine time series evidence surrounding this potential explanation. They find that, while some decades do see increasing capital productivity leading to erosion of the labour share, other decades do not, for example the 2000s which saw declining productivity growth and a decreasing labour share.
Additionally, something obscured by the trend line in the chart above, the period from 1950-1980 shows that the labour share fluctuated around a relatively constant mean of 64%. In order for technological change to be engendering a decline in the labour share, a fundamental change in the way technology has been progressing in the world economy would have to have occurred around 1980 in order to cause the more precipitous and continuous erosion of the labour share of income until the end of the years shown. This is certainly a challenge to prove. Among other explanations, some have pointed to the increasing surplus of low-productivity, high-profitability labour as a function of globalisation as a contributing factor. As more labour-intensive industries see their production increasingly off-shored and advanced economies are continuing to rely on high-human capital, capital-intensive production, the proportion of income going to labour has decreased.
Looking into the future, increasing economic inequality is something with which world leaders and economists will need to contend. The decrease in the labour share of income illustrates this very well, and provides a rationale for poverty being a relative measure instead of an absolute standard as it is often treated today. The world economy cannot sustain itself if the majority of its participants are experiencing a decline in real income. Since inequality is not a self-evident vice, this raises the stakes for those wishing to shed light on the issue and certainly requires nuanced thinking and responses from policy makers.
Week 7, 2019

