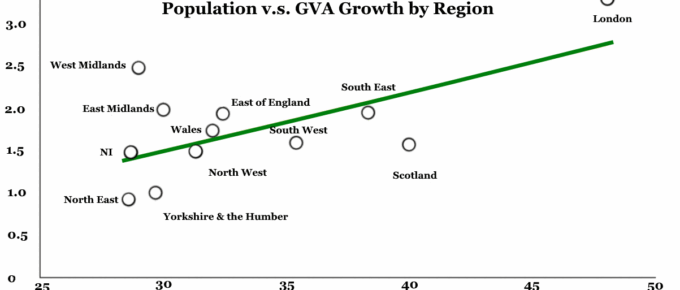
To varying extents, London has led the UK’s economic growth since the 1990s as a product of financial deregulation which not only boosted GVA but also served to attract more degree-educated …
Taxes and Attitudes
Participation in society, crime, tax evasion, and general ‘social cohesiveness’ can reveal much about social preferences when it comes to tax rates and government programs such as wealth redistribution. …
UK 18 Year Olds: Employment, Unemployment and Inactivity
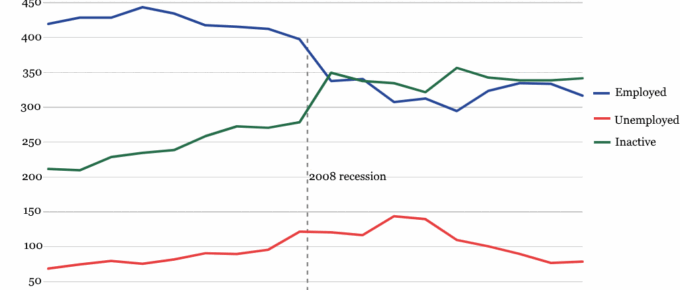
Following the economic downturn, workers aged 18 did not experience the rise in unemployment that their older counterparts. This may be due to the relatively lower cost of employing 18 year old workers to minimum wage positions …
Chart of the Week: Week 39, 2015: EU Youth Unemployment
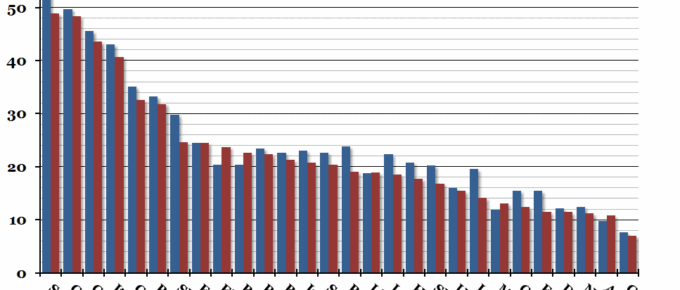
European unemployment figures were released by Eurostat this morning, and showed a continuation of the downward trend in the aggregate EU unemployment rate.
Chart of the Week: Week 5, 2015: EU Youth Unemployment
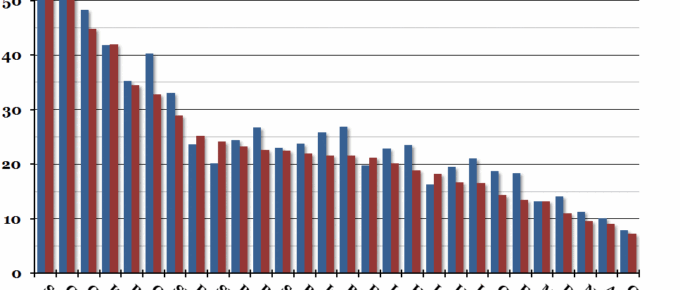
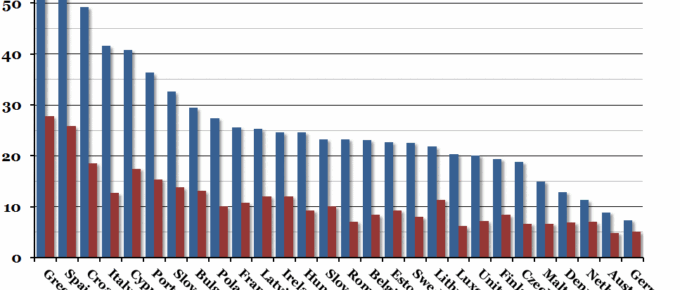
European unemployment figures for December 2014 were released at the end of last week, and both the headline figure and youth unemployment were down compared to the end of 2013 (unemployment was down from 10.6% to 9.9% and youth unemployment was down from 23.1% to 21.4%).
Chart of the Week: Week 6, 2014: EU Unemployment Comparison
Eurostat released the European Union’s latest unemployment statistics at the end of last week, and they showed an overall rate of 12% in December 2013, compared to 11.9% in December 2012.

