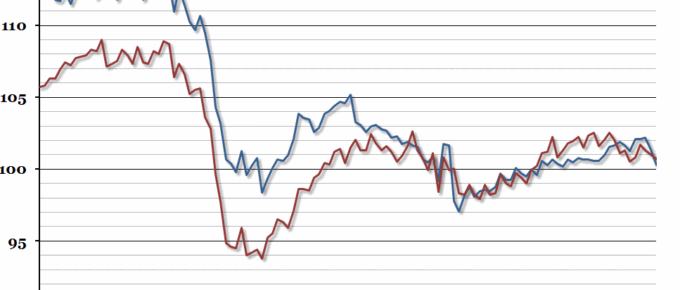
This morning the UK’s production index for the end of 2015 was released, and it showed that the poor end to the year left the UK’s production sector, and in particular manufacturing, smaller than at the end of 2014.
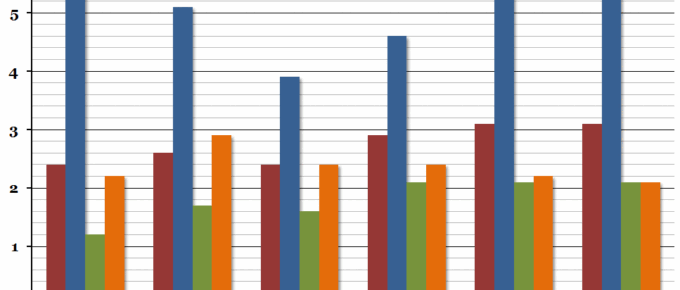
Chart of the Week: Week 4, 2016: Projected GDP Growth
Tomorrow morning, the preliminary estimate for UK fourth quarter GDP growth will be announced, and we’ll get a first impression of annual growth for 2015.
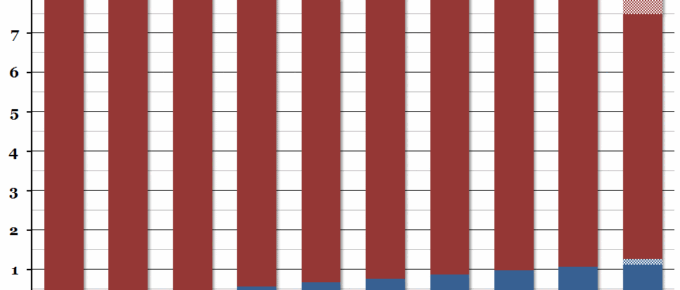
Chart of the Week: Week 2, 2016: UK Household Debt
Aviva’s latest Family Finances Report contains the worrying statistic that average household debt is now at its highest point since they started tracking it in 2011, although it is not yet quite as high as a proportion of net household income as it was in Summer 2013.
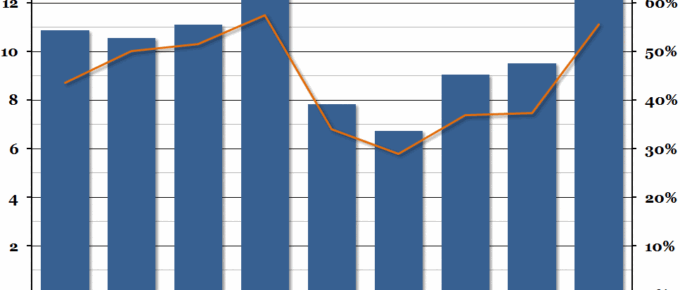
Chart of the Week: Week 51, 2015: Christmas Retail Spending
Every year, retail sales spike in December in the UK as people spend money on presents and preparations for Christmas celebrations.
December 2015
Apart from the normal and incalculable unknown unknowns, a possible debt explosion or a Putin play, 2016 is likely to see a steady improvement in the economic environment. 2 to 3% growth with near zero inflation is really quite benign. With Governments, albeit at glacial speed…
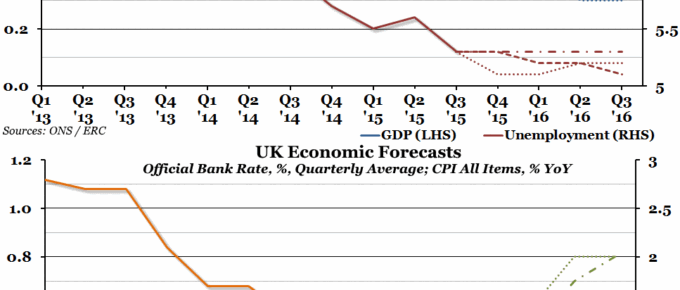
Chart of the Week: Week 49, 2015: UK Economic Forecasts
Last week, the Economic Research Council hosted our fifth annual economic forecasting event, the “Clash of the Titans”, where we invited three economic experts to give their forecasts for 2016.

