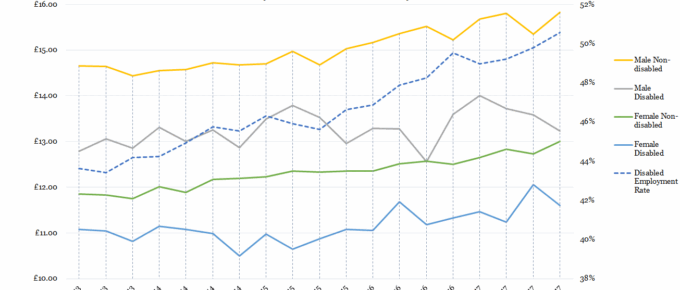
While non-disabled men’s and women’s wages have been incrementally rising since 2013, those of their disabled counterparts…
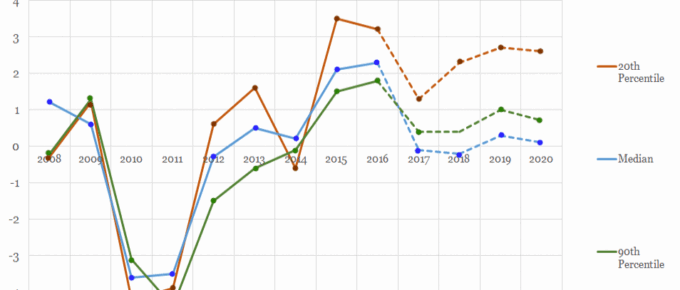
Chart of the Week: Week 14, 2017: Trends in Take-Home Pay
The chart shows that take home wages for the 2nd and 9th decile of earners have been strongly correlated in the years since the financial crisis.
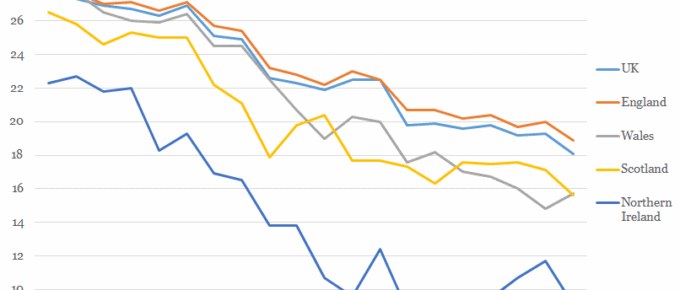
Chart of the Week: Week 13, 2017: Gender Pay Gap by Country
This Tuesday 4th April was ‘Equal Pay Day’, a date symbolically chosen in the USA for two reasons: it roughly represents the date when the average woman would need to work to, from 1st of January 2016, to match the average man’s 2016 earnings.
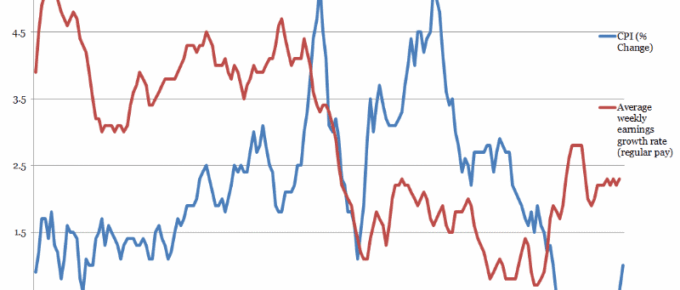
Chart of the Week: Week 42, 2016: Inflation vs. Earnings
The latest ONS figures, released yesterday show that inflation seems to be in the initial phase of converging with wage growth, currently at a tolerable level.
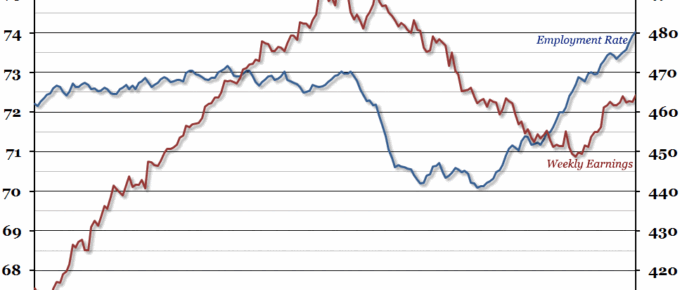
Chart of the Week: Week 3, 2016: Employment and Earnings
Labour market statistics were released today, and they showed another record high employment rate (74%).
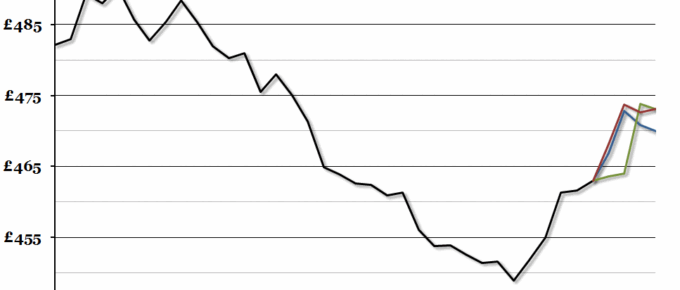
Chart of the Week: Week 48, 2015: UK Average Earnings Forecasts
The Economic Research Council’s fifth annual Clash of the Titans economic forecasting event was held on Wednesday 2nd December, where three economic experts gave their opinions on what will happen to the UK economy in 2016.

