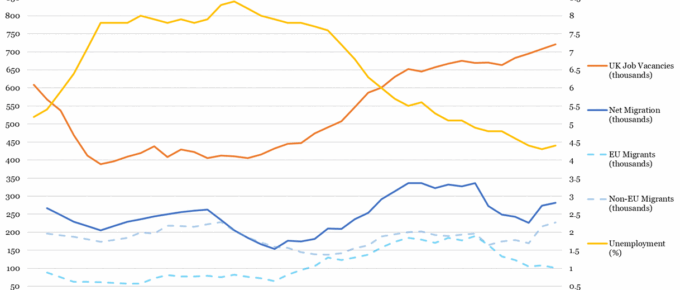
Following the recession, unemployment increased to its highest level since 1995 at 8.4% of the workforce in 2011 Q4. It has since recovered, halving to its current rate of 4.2%, (898,700 persons) , its lowest since 1975. Recent trends in job vacancies and unemployment are…
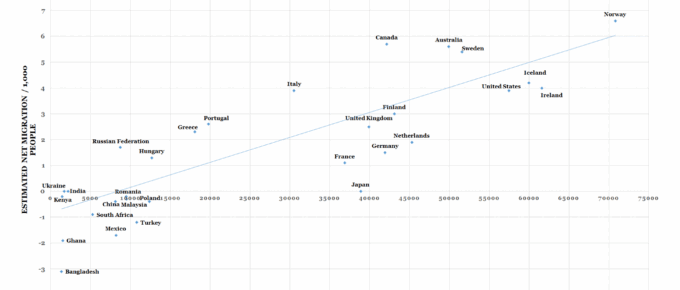
Chart of the Week: Week 32, 2017: GDP per Capita v.s. Net Migration
This chart plots 31 countries according to the level of GDP and net migration relative to their populations.
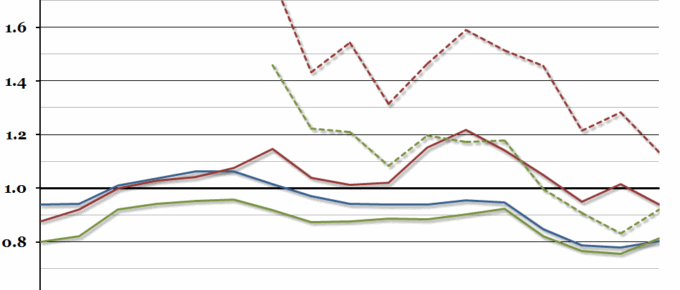
Chart of the Week: Week 45, 2013: Fiscal Effect of Immigration
A paper was published this week by the Centre for Research and Analysis of Migration (based in UCL), investigating the impact different immigrant groups have on the UK Government’s budget.


