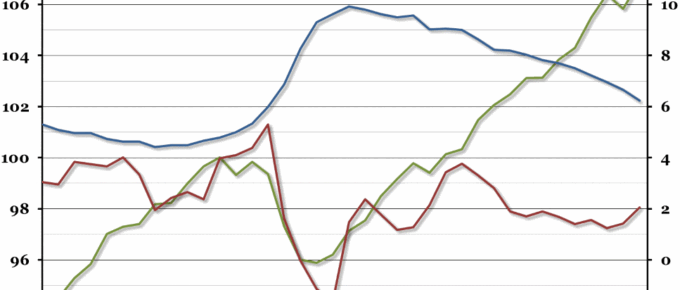
Contrary to most economists’ expectations, the overall growth rate in the first quarter of this year remained unchanged last week, at a disappointing 0.3% (most people had expected it to be revised upwards).
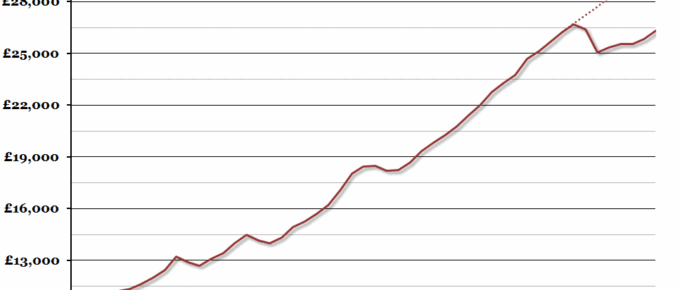
Chart of the Week: Week 4, 2015: UK GDP Per Capita
Preliminary growth figures for the final quarter of last year were released yesterday, and although quarterly growth slowed down to 0.5%, 2014 was still the best year of growth since 2007 with an annual rate of 2.6%.
Chart of the Week: Week 51, 2014: Clash of the Titans
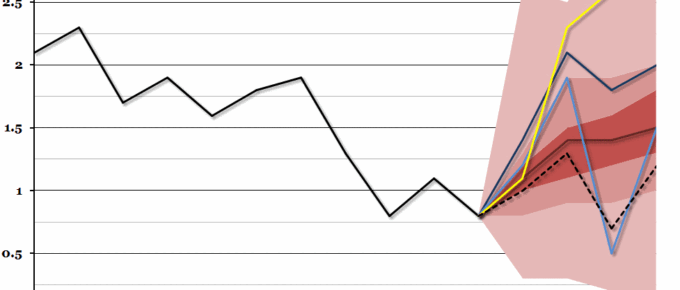
Our annual Clash of the Titans economic forecasting competition is taking place tomorrow night (the 18th December), so we’ve taken a look back at last year’s predictions and how they compared to what actually happened.
Chart of the Week: Week 34, 2014: The Eurozone Recovery
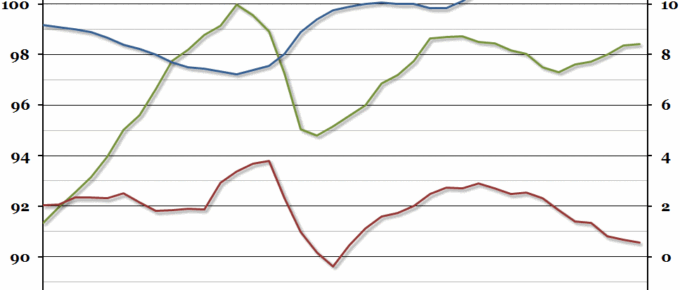
Following on from our graph recording the impressive US recovery a fortnight ago, this week we have taken a look at the much more limited recovery in the euro zone.
Chart of the Week: Week 32, 2014: The American Recovery
In contrast to the UK recovery (covered by last week’s chart), the US economy has been looking very positive for a while now.
Chart of the Week: Week 31, 2014: UK Recessions and Recoveries
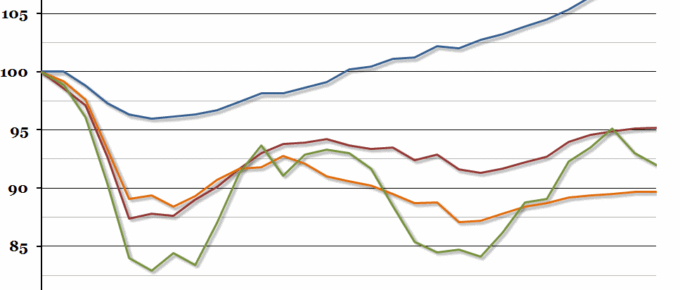
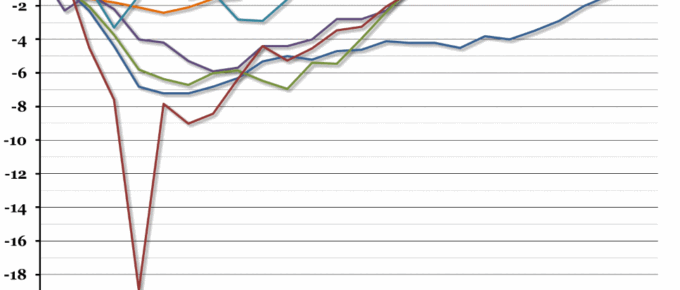
The preliminary estimate of GDP growth for the second quarter of 2014, released at the end of last week, suggested that the UK economy has finally overtaken the previous peak of output before the recession in 2008.

