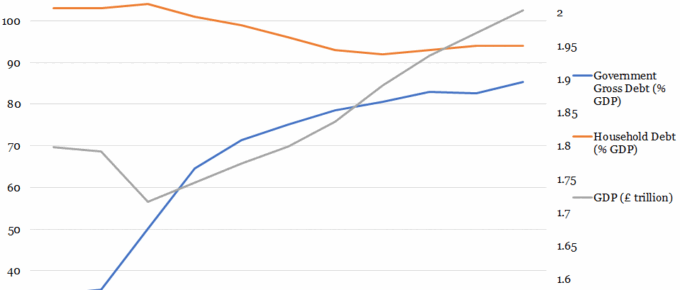
Over the past 40 years, government debt as a proportion of GDP has predominantly remained in the 30%-50% range. This trend ended with the financial crisis, after which government policy has been centered on reducing the debt to GDP ratio…
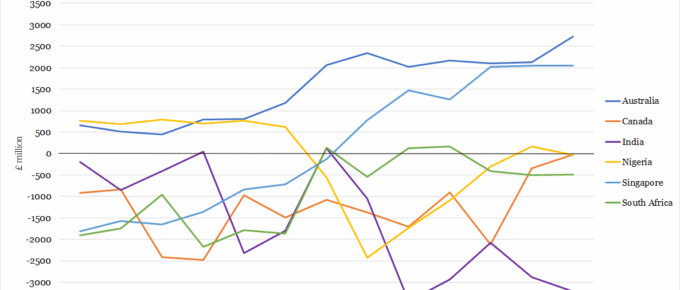
Chart of the Week: UK Trade Balance with Largest Commonwealth Economies
Already existent strong trade ties between neighbouring nations could potentially prove limiting for Britain’s trade expansion …
The Clash of the Titans Event: *Speakers announced!*- 5th December 2018
An unrivalled opportunity to hear economic experts detail their predictions for 2019…
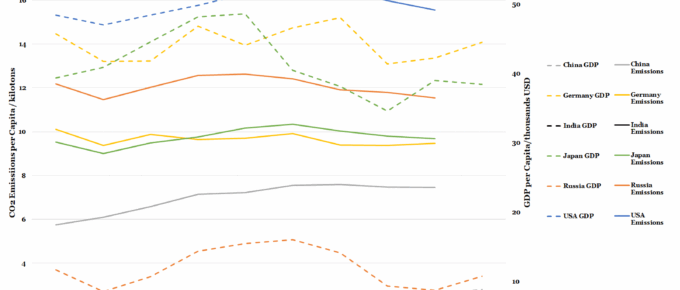
Chart of the Week: Six Highest Polluting Nations’ Emissions vs GDP
Despite China experiencing GDP growth of 6.9% and a CO2 emissions rise of 1.4% last year, the nation had …
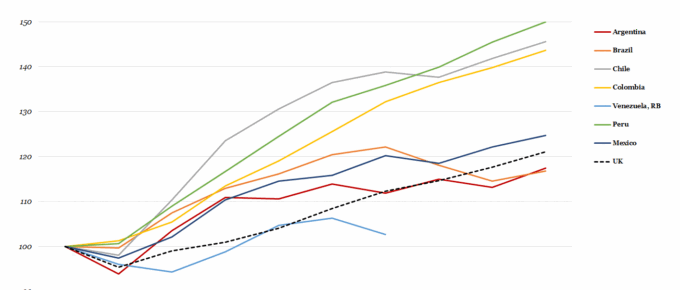
Chart of the Week: Week 30, 2018: GDP per Capita of Latin America’s 7 Largest Economies
The post-recession trends in GDP per capita of South America’s seven largest economies have varied over the last decade. All economies were affected differently by the 2008 financial crisis but…
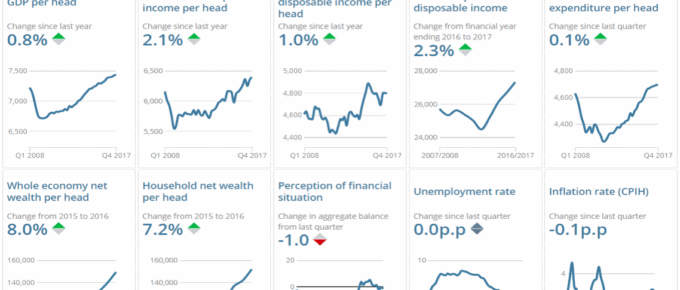
Chart of the Week: June 2018: Explore Changes to the UK Economy
The charts show key changes in the UK economy… click to find out more!

