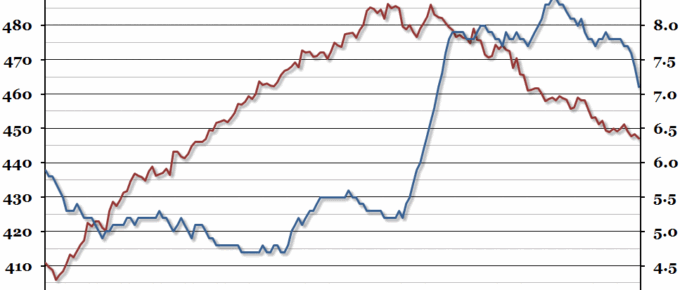
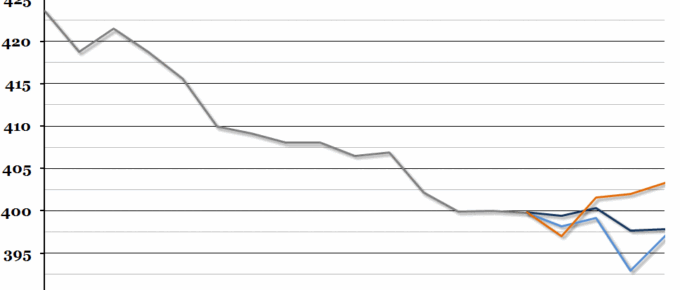
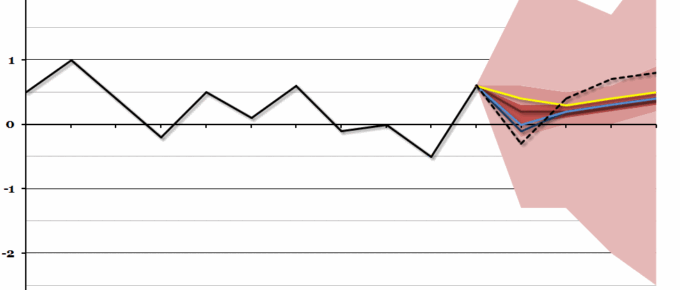
The monthly labour market statistics brought further good news this week as the unemployment rate fell to 7.1% in the three months leading up to November 2013.
Latest Blogposts
Chart of the Week: Week 3, 2014: Inflation Hits 2% Target
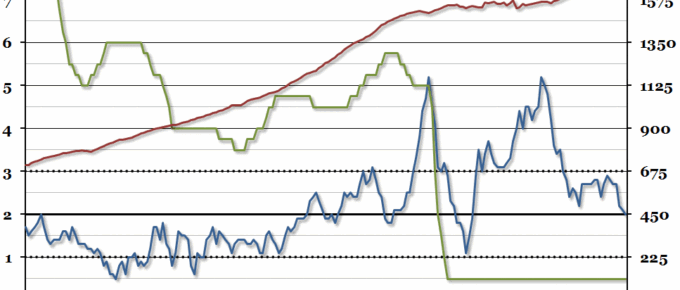
The CPI measure of inflation hit the Bank of England’s 2% target this week for the first time since November 2009.
Chart of the Week: Week 2, 2014: European Bond Yields
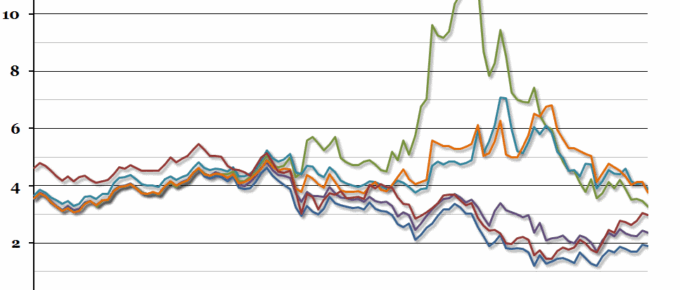
A lot has been happening in the European bond yield markets this week, as a recent (successful) sale of bonds by the Irish government gave a boost to borrowing rates across Europe, and the gap between UK and German bond yields increased to the largest it has been since 2005.
Chart of the Week: Week 51, 2013: Historical Household Spending
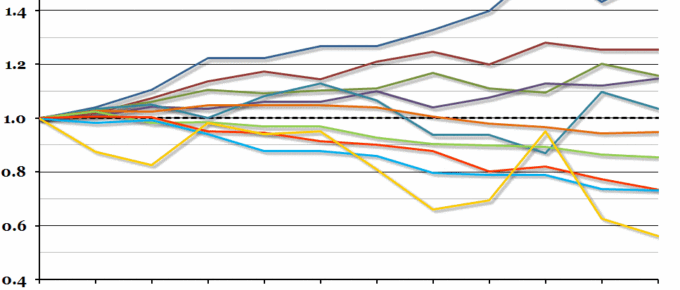
The Office for National Statistics’ annual household spending report came out last week, so this week’s chart is on how household spending has changed over the past decade (just in time for Christmas).
Chart of the Week: Week 50, 2013: UK Average Earnings Forecast
The Economic Research Council’s third annual Clash of the Titans was held last night, and we received three sets of forecasts from three leading economic thinkers (you can see their forecasts in full here).
Chart of the Week: Week 49, 2013: Clash of the Titans
As the annual Clash of the Titans economic prediction competition is taking place next week on the 10th December, we’ve taken a look back at last year’s forecasts.

