Monday 13th December, 7pm, online.
Chart of the Week
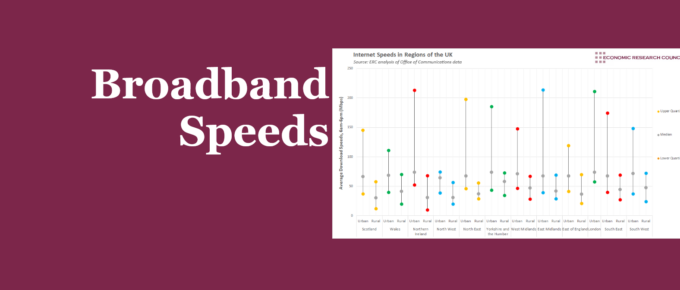
Project Gigabit is scheduled to roll out fast broadband connections to remote locations in the UK. The chart shows that certain areas are in desperate need of it.
Chart of the Week
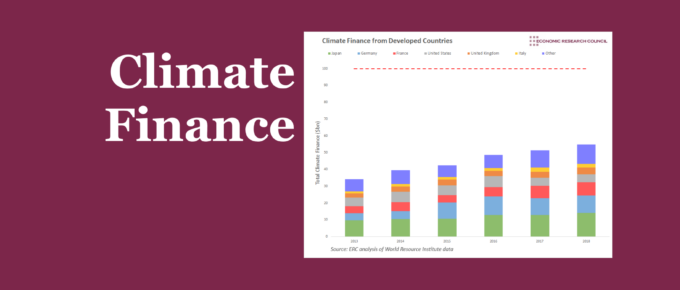
With COP26 well underway, we analyse the efforts that developed countries have made in climate finance. Over time, contributions have increased for each of the top 6 nations analysed, other than the United States.
Chart of the Week
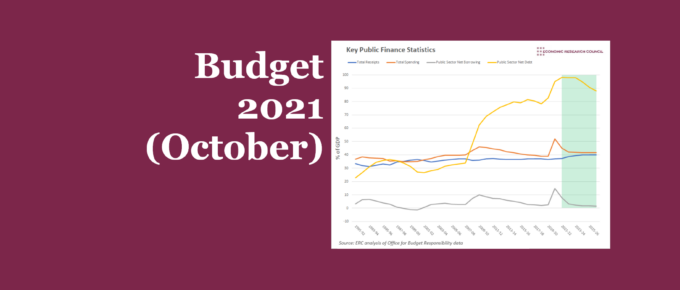
In light of the budget and spending review, we use a series of charts to take a deep dive into the key announcements, the Office for Budget Responsibility (OBR) forecasts, and what this means for UK plc in the upcoming years.
Chart of the Week
The extent to which can affordably rent varies considerably across the country, with London, naturally, being least affordable. We show that this isn’t just an issue for those on lower incomes.
Chart of the Week
Our chart presents recent statistics on furloughed staff throughout the pandemic. Younger and older people were both more likely to be furloughed compared to those in between. Those with high levels of education have been less likely to be placed on furlough, while the industries that were most an least effected correlate with the extent they have been able to remain open through the pandemic.


