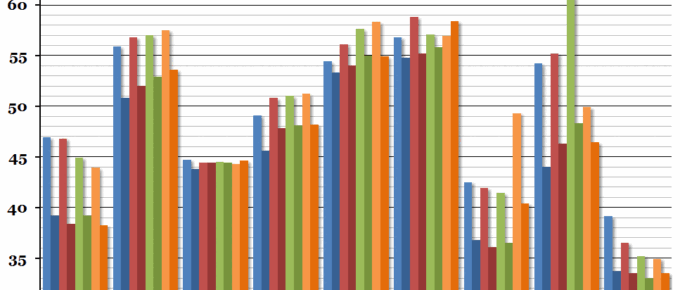
We are in the last quarter, the future for North America looks good, Europe confused, China difficult and countries reliant on the production of commodities gloomy. The West and Russia, however….
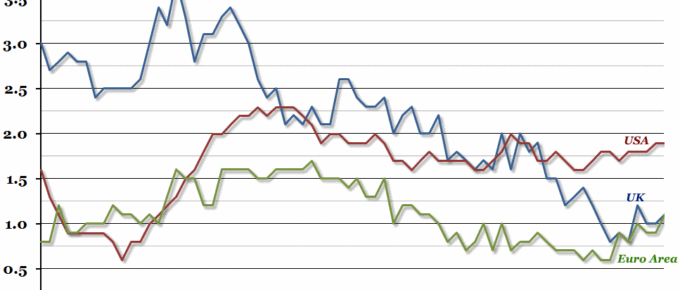
Chart of the Week: Week 46, 2015: Core Inflation
October inflation figures from around the world have been released this week, and certainly among most of the advanced economies, headline inflation has remained at near-zero (it was 0.2% in the US, 0.1% in the Euro Area, and -0.1% in the UK).
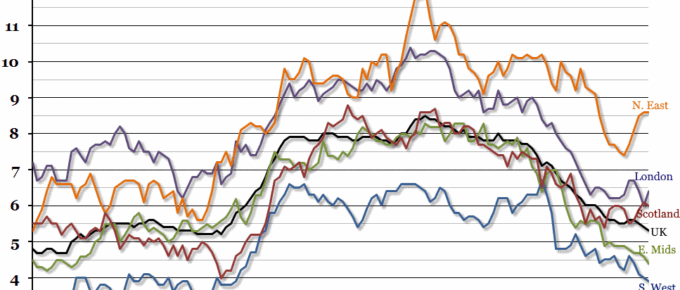
Chart of the Week: Week 45, 2015: Regional Unemployment
After a brief stutter last quarter, the UK’s headline unemployment rate continued to fall in the third quarter of the year, to 5.3% (the lowest it has been since the beginning of 2008, when it stayed at 5.2% for around six months).
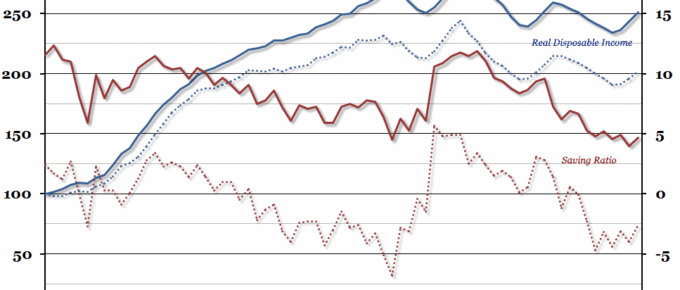
Chart of the Week: Week 44, 2015: UK Household Finances
On Monday, the Office for National Statistics issued a revised measure of both real household disposable income and the household saving ratio, which made them seem worse than previously thought.
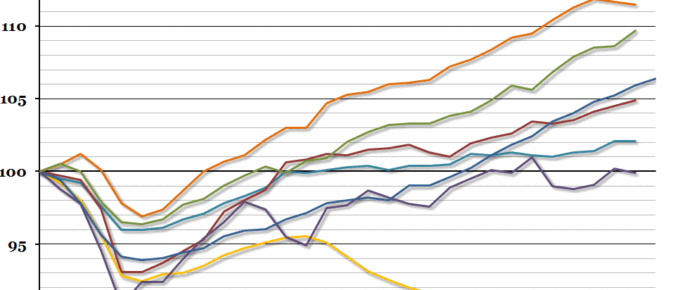
Chart of the Week: Week 43, 2015: International Post-Recession Recovery
Preliminary figures released by the Office for National Statistics yesterday suggested that UK GDP growth in the third quarter of the year was 0.5% – lower than the previous quarter’s growth rate of 0.7%, and the consensus forecast of 0.6%.
Chart of the Week: Week 42, 2015: EU Government Finances
Eurostat announced their updated statistics for European government finances this morning, and the headline figure showed that across the EU, the average deficit improved from 3.3% to 3%.


