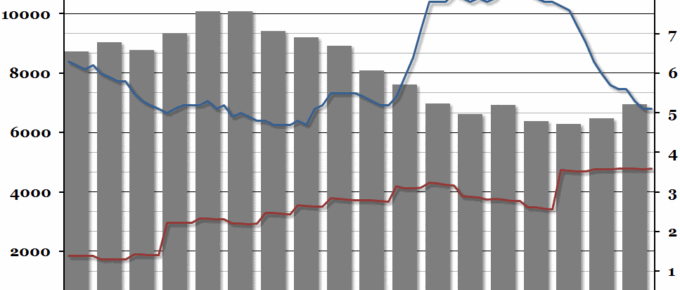
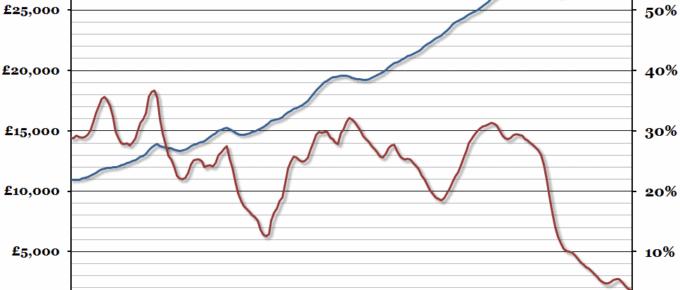
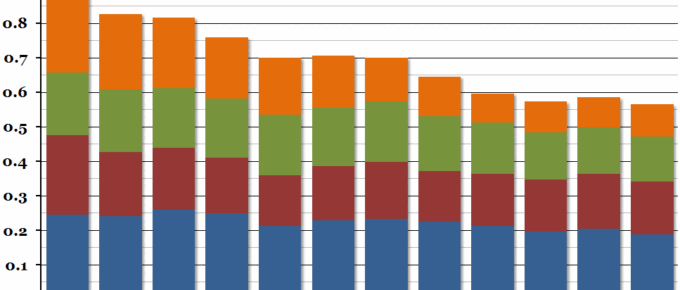
Despite the experience of the 1980s when crime rose sharply with unemployment, crime rates in the UK have remained static post the financial crisis despite large fluctuations in unemployment.
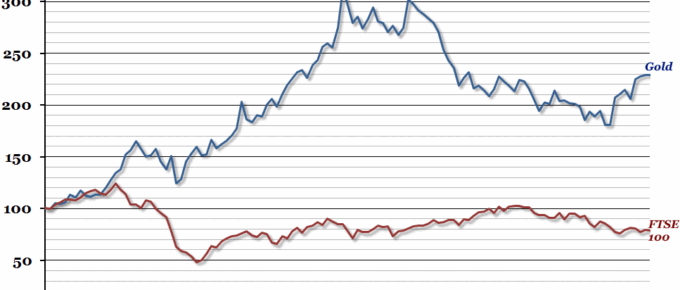
Chart of the Week: Week 33, 2016: Price of Gold vs. Equities
Had they invested in August 2006, investors in Gold have would have received a return of over 100%, whereas investors in UK equities (as measured by the FTSE 100) would have received less than their initial investment.
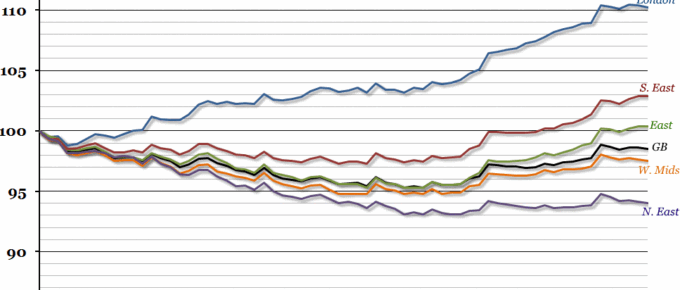
Chart of the Week: Week 32, 2016: UK Private Rent inflation
Over the past 5 years, rental prices in the UK on average have remained broadly stable.
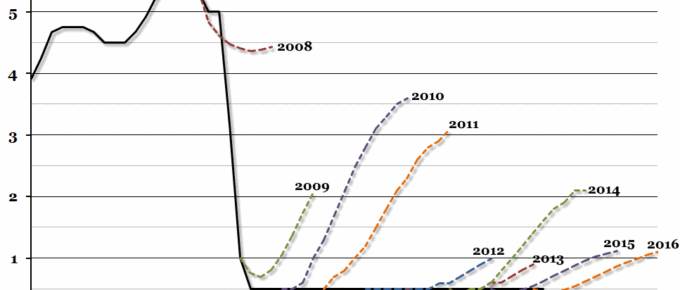
Chart of the Week: Week 31, 2016: UK interest rates
UK interest rates remain at the historic “emergency” low of 0.5% set by the MPC in March 2009, and financial markets have consistently overestimated the likelihood of a rate rise since then.
Chart of the Week: Week 30, 2016: UK GDP Per Capita
The preliminary estimate for GDP growth in the second quarter of 2016 was 0.6%, slightly higher than in the first quarter of the year.
Chart of the Week: Week 29, 2016: Science, Engineering and Technology Spending
The Office for National Statistics released their annual report on government spending on science this week, and although in nominal terms spending has increased by more than £2 billion since 2003, it has fallen significantly as a proportion of GDP.

