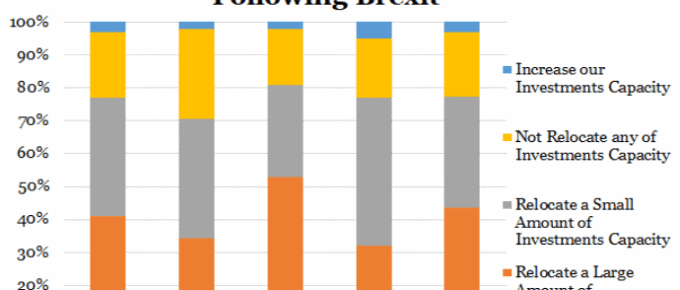
The chart shows a very pessimistic view of investment in the UK as a result of Brexit. On average, over three-quarters of companies headquartered in the displayed nations have stated their intention to move at least some of their investments out of the UK as a result of Brexit.
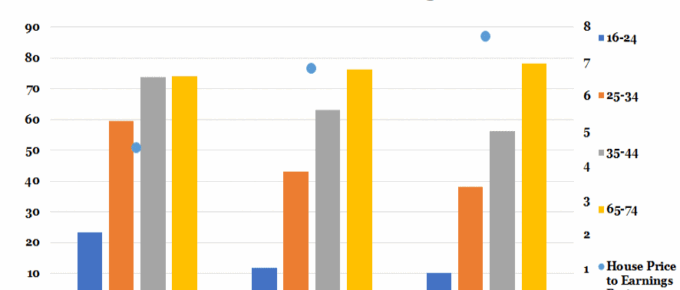
Chart of the Week: 20th June 2018: Home Ownership vs House Price to Earnings Ratio
Last year saw the emergence of five London boroughs where houses ‘earned’ more in a year than their owners; most starkly in Barnet, where on average home-owners earned £54.6k net whereas their homes grew in value by nearly £107k.
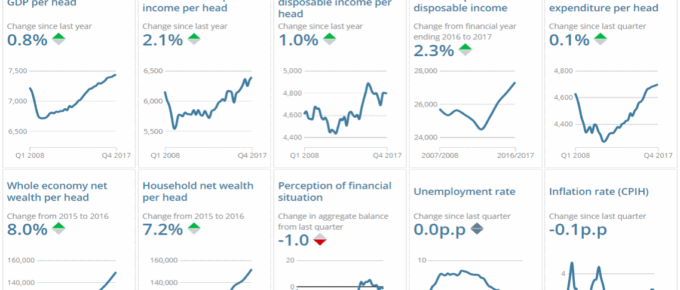
Chart of the Week: June 2018: Explore Changes to the UK Economy
The charts show key changes in the UK economy… click to find out more!

Read the ERC’s Privacy Policy
Read how the ERC uses and protects your data.

Shanker Singham, Director, International Trade and Compliance Unit at IEA
Join us at 6.30pm on 26th June to hear from Shanker Singham, Director of the International Trade and Competition Unit (ITCU) of the Institute of Economic Affairs

May 2018
Since putting pen to paper in February, there has been a more than usual amount of trivia in the headlines. The global economic expansion has steadied and in many areas, the rapid growth of last year has dropped to more realistic single digit figures…