Summary
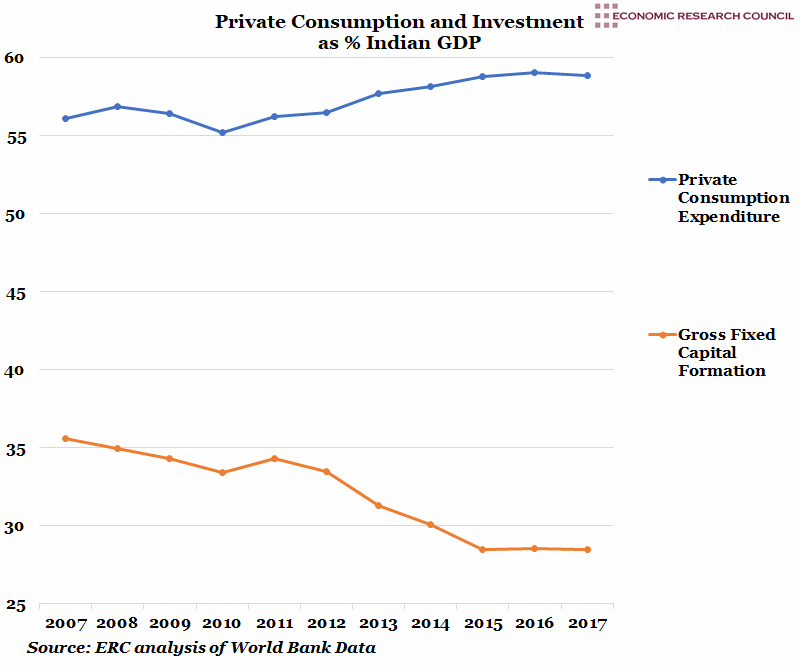
Private consumption as a percentage of Indian GDP rose from a low of 55% in 2010, to a peak of approximately 59% in 2017. In real terms, this modest percentage rise equates to some $656 billion US Dollars. The initial data for 2018 shows that consumption is still growing faster than ever.
The pre-crisis era in India was characterised by growth in both savings and investment, with investment expenditure the highest at the end of 2010 as a percentage of GDP. Indeed growth in gross fixed capital formation (GFCF) peaked in 2009-10 when it was almost a quarter higher than the year prior. However on average growth between 2010 to 2017 was 7%. Gross domestic savings as a percentage of GDP increased from 2000 until 2007/08 peaking at about 35%. It has declined thereafter.
Unfortunately, India’s investment in physical assets has been showing a downward trend since 2011 and has remained more or less constant since 2015. The Reserve Bank of India recently reported that combined new investment projects from government and private sector have declined between the start of the financial year 2015 (4 trillion rupees) and 2018 (approx. 2.5 trillion rupees).
Government initiatives to invest in several sectors such as shipping, telecommunications and the micro to medium enterprises will no-doubt bolster future economic development. However the government has also relaxed rules for FDI inflows, reflected in the improvement in the Ease of Doing Business Index, with noteworthy investment from Vodafone, Flipkart, Ikea and the Japanese collaboration on infrastructure projects in the north-east. IFC, the investment arm of the World Bank intends to divert $6 billion USD in sustainable and renewable energy programmes until 2022.
What does the chart show?
The blue line represents total final household expenditure. This includes expenditure made on behalf and in the interest of households by non-profit organisations. The orange line represents Gross Fixed Capital Formation. Both data sets are expressed as a percentage of Indian GDP, originate from the World Bank and are measured against the left hand side axis.
The household expenditure encompasses spending on goods and services, including food, clothing, healthcare, leisure and miscellaneous items. Gross Fixed Capital Formation reflects investment in physical assets with the cost of any land purchases deducted. The data are represented in annual intervals between 2007 to 2017.
Why is the chart interesting?
Indian Finance Minister Arun Jaitley recently asserted that, as the only economy growing at the rate of 7-8% globally, the ability to sustain such staggering growth levels would relate to the growth of the Indian middle class and their commensurate rise in consumption.
India’s rise in consumption has been largely attributed to demographic changes, particularly the large population of millennials who are enjoying far greater prosperity than their parents’ and grandparents’ generation. According to a report by Deloitte, Indian millennials have high levels of disposable income, bringing in over two-thirds of total household income. Indeed they spend higher proportions of their income on discretionary lifestyle to their parents. They are also putting comparatively less into savings.
With elections looming in April/May, the Modi administration has recently released an interim Union Budget proposing policies that offer a rebate to taxpayers earning up to 500,000 rupees (7000 USD), benefitting some 30 million individuals. This raising of their disposable income may be intended to increase consumer spending or indeed to encourage saving. Further tax breaks across all brackets extend these savings further up the income scale.
Policy-makers have expressed that increasing investment should be a priority in India. Indeed, a recent study (Kharoubi and Kohlscheen 2017) has suggested that growth fuelled purely by consumption can harm future economic growth via ‘growing imbalances due to limits to capacity creation, and rising debt burdens particularly for households’. Although Indian household debt as a percentage of GDP has risen steadily since 2014 to about 11.5% in 2018/19; it pales in comparison to Chinese household debt (currently at 49.3%). Indian household debt growth has been fuelled by widening access to personal loans, which have seen year-on-year growth of over 16% since 2016. Furthermore, it appears that the government plans to abolish landlord’s taxes for those owning two properties, a move likely to attract more investors in the household market.
Rural fast moving consumer goods market is estimated to be one of the most significant growth areas in the Indian economy and is forecast to grow by around $200 billion by the year 2025. Economic liberalisation in the 1990s, increases in literacy levels and interconnectedness through digitisation are the main drivers behind the urbanisation of rural lifestyles. Reported recently in the Hindu Business Line, a study by a customer marketing company predicts that the rural segment will see a rise in expenditure in conveyance, education and medical spending. Prospects such as these have pushed multinationals including Zara, Nestle and Samsung to invest in the Indian consumer market.
Many assert that investing in capital and infrastructure increases labour productivity, thereby increasing output per capita. India’s current labour productivity growth stands at 5%, half its level in 2010. India Ratings and Research recently estimated that to achieve GDP growth of 9%, a further 7.8% increase in the labour productivity would be required. Should these investments be directed towards R&D and human capital via education, the country stands to gain even higher boosts to output per capita and GDP. India’s investment in R&D as a percentage of GDP has remained at about 0.7% for over a decade. For comparison, Chinese and UK R&D spend is 2.1% and 1.7% respectively.
Half of Indian R&D spend is undertaken by central government alone, who now may seek to nudge the state governments to show greater interest in R&D. The government further highlights an urgent need for universities to break-free from traditional teaching-focussed practice towards increasing research-led activities.
Week 6, 2019

