Summary
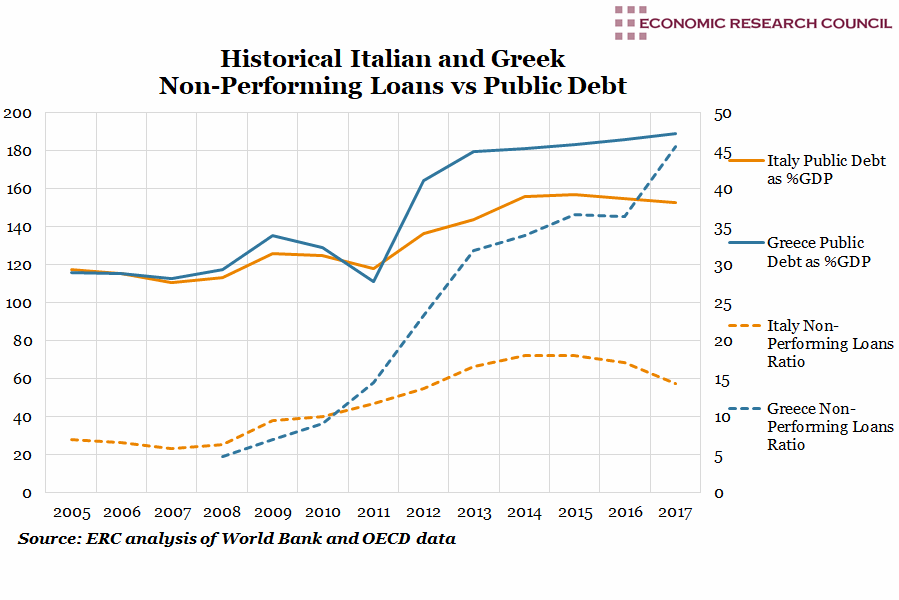
Despite Italy and Greece both receiving bailouts in the Eurozone’s sovereign crisis in 2010, both nations have seen continued increases in the number and scale of non-performing loans. Non-performing loans play a major role in impeding economic growth, as banks are not left with adequate capital to stimulate investment in the economy. Greece’s NPL ratio continues to be the highest in the Eurozone, rising further in 2018 to 47.8%. Italy’s NPL ratio has been declining since a high of just over 18% in mid-2015, reaching 11.4% in July 2018. The drop from 2015 to 2017 is likely due to burgeoning economic growth alongside some restructuring of these loans by banks. The Greek government’s GACS scheme, introduced in 2016, liberalised banks’ ability to offload the loans via sales and securitisation. Although the value of Greek NPLs decreased from June 2016, the reduction in value of total loans more than offset this, resulting in higher NPL ratios. The more significant reduction in Italy’s NPL ratio relative to Greece’s is likely a product of Italy’s stronger position within the EU, its access to global financial markets and commensurate ability to sell off or restructure more of the delinquent loan portfolio.
What does the chart show?
The solid orange and blue lines show Italy and Greece’s public debt as a percentage of their GDP respectively, displayed against the left hand axis. The orange and blue dotted lines show Non-Performing Loans (NPL) expressed as a percentage of total gross loans, displayed against the right hand axis. This refers to loan value and includes business, personal and residential borrowing. The data is presented in annual intervals spanning from 2005 to 2017. The data for Greece’s NPL ratio is unavailable annually prior to 2008. Data for NPL ratios are taken from World Bank, whereas data for public debt as a percentage of GDP are taken from OECD. Non-Performing Loans, sometimes referred to as delinquent, values bank loans that have been left outstanding for a minimum of 90 days.
Why is the chart interesting?
The chart demonstrates that, although Italy and Greece share a similar narrative in terms of poor loan performance across business, personal and residential loans; they have experienced widely differing outcomes. This reflects the difference in the size of their economies and commensurate power within Europe. Former Greek finance minister Yiannis Varoufakis famously compared the Greek economy within Europe as similar in size to that of a Michigan within the USA, whereas the Italian economy has consistently been within the largest five of the EU. Accordingly, Italy was afforded a great deal more flexibility in loan renegotiation via relatively more secure access to international financial debt markets.
As their creditors were predominantly German banks, Greece found itself far more beholden to demands to take bailout funds, with the accompanying policy interventions of the ECB, IMF and EU. Greece reported a high budget deficit just after the financial crisis, causing a market shock that the EU sought to remedy with nearly £100 billion of financial support in return for drastic austerity measures. These measures were intended to boost confidence and encourage investors to reduce premiums on Greek sovereign debt, resulting in higher economic growth through sustained low interest rates. However, in a climate of reduced public and private investment, the suppression of wages and welfare benefits resulted in reduced consumer spending and reinforced Greece’s economic decline via rising unemployment and reduced tax income.
Italy has resisted similar calls from the ECB since the financial crisis, who have sought to bring Italy within the remit of EU legislated debt to GDP ratios resulting in an increasingly tumultuous relationship with the EU and much talk of ‘Quitaly’. Similar to Syriza in Greece, many Italian parties are reticent to commit to implementing austerity, and indeed the government has ambitious spending plans to lift 9.4 million citizens out of poverty. Although mainstream commentators dismiss populist parties such as the anti-establishment coalition between Five Star Movement and The League as simple exponents of xenophobia and racism, their pledge to introduce economic reforms also contributed to their support amongst the electorate. Promises such as Universal Basic Income, a flat tax rate between 15% and 20% and the abolition of the unpopular Fornero Pension Law appealed to poorer voters. These plans are costly and according to EU rules would result in serious non-compliance and lead to financial penalties that would further hamper economic output by roughly 9 billion euros.
This is what has sparked discussion of Italy leaving the EU and reverting back to the Lira, something that would have catastrophic spillover effects on the equity and bond markets in the region. There were fewer suggestions of Greece leaving the EU, a result not only of the timing of their debt crisis preceding both the entrenchment of populism across Europe and Britain’s decision to leave the EU; but also of Syriza’s more pro-European stance.
Week 50, 2018

