Summary
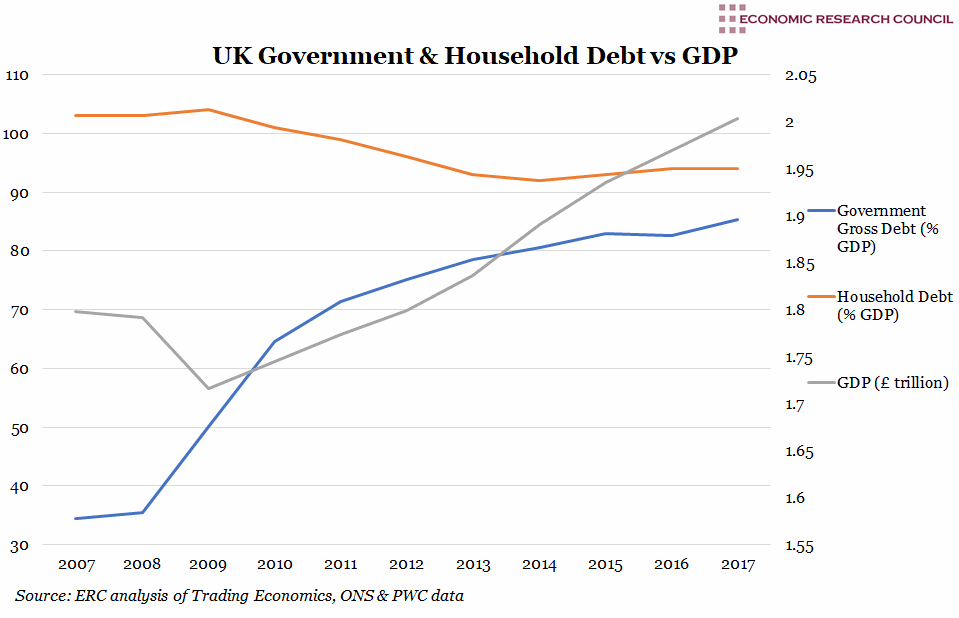
In the period shown, government gross debt as a percentage of GDP increased 2.5 fold and household debt remained between 90% to 110% of GDP. Following the financial crisis, the UK’s debt burden surpassed 250% of GDP excluding financial sector debt but including government, non-financial companies and household debt, a steep increase from less than 200% at the turn of the millennium. Since the crisis, household debt decreased marginally and government debt increased drastically, even when government bank bailouts are excluded. In the immediate post-crisis years, private sector debt continued to rise, likely bolstered by the availability of cheap credit for large companies, a knock on effect of QE. A significant fall in tax revenue, coupled with automatic stabilisers (for example welfare/benefits) taking effect led to the increase in public sector debt. Although austerity measures and asset sell offs went some way to reducing the deficit, the increase in total government debt to GDP ratio has continued to mount. The current economy remains more indebted than pre-crisis levels (total cash value of debt in the UK economy was £7 trillion in 2018, compared with just over £2 trillion in 2000).
What does the chart show?
The orange line shows the UK’s household debt and the blue line shows the UK’s government gross debt, both displayed as a percentage of GDP. These values are measured on the left-hand axis. The grey line shows UK GDP measured in £ trillion against the right-hand axis. The data is presented at annual intervals and spans 2007 to 2017. The government gross debt data originates from Trading Economics and the household debt data from PWC. The GDP figures are supplied by the ONS.
Why is the chart interesting?
Over the past 40 years, government debt as a proportion of GDP has predominantly remained in the 30%-50% range. This trend ended with the financial crisis, after which government policy has been centered on reducing the debt to GDP ratio. Significantly, despite austerity policies, although the budget deficit has narrowed, gross debt has, in fact, increased from 79% to 85% of GDP between 2013 and 2017. However, the absolute value of debt stock has increased from less than £1.45 trillion to just over £1.7 trillion during the same period.
The government’s current stated aim is to bring the structural budget deficit below 2% of GDP and for the net debt-to-GDP ratio to be in decline by 2020/2021. While the government has already enacted a vast number of measures to reduce expenditure, future pressures, particularly on NHS and social care budgets, throw their longer-term ambitions into doubt.
Prior to the financial crisis, gross household debt and mortgage debt rose sharply in relation to disposable income due to a combination of the continued surge in house prices, low levels of unemployment and relative economic stability. In turn, this led to more relaxed lending criteria and an uptick in the number and scale of households taking on debt. However, the financial crisis forced these trends into reverse and the ratios of household and mortgage debt to disposable income fell from their 2007 peak. In attempts to recover the economy post-crash, banks were obliged to tighten mortgage lending conditions, further undermining consumer confidence.
Consumer behaviour appeared to return to pre-crisis trends in 2015. The uplift in consumer confidence is likely attributable to the loosening of lending conditions on unsecured credit in the longest period of low to zero interest rates in modern times.
Week 47, 2018

