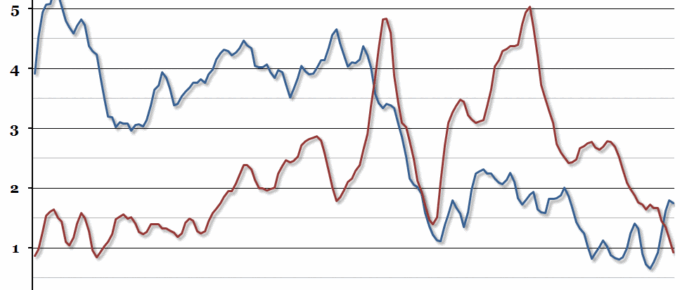
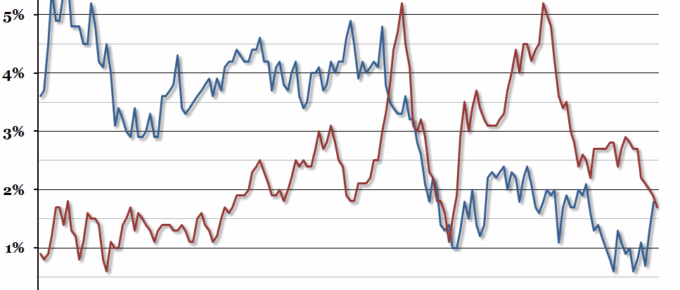
This week we’ve received two big bits of economic news: CPI inflation fell to just 0.3% in January, while earnings growth remained roughly steady at 1.7% in the three months to December.
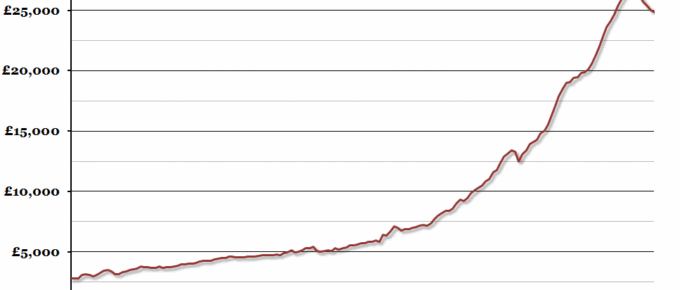
Chart of the Week: Week 42, 2014: Real Average Salary
In a report released over the weekend, the TUC claimed that the current squeeze in real earnings is the most severe since our records began almost 160 years ago.
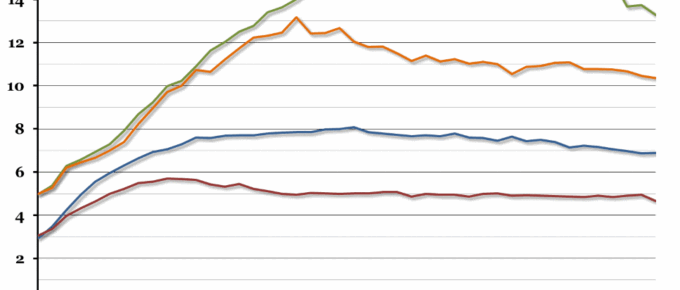
Chart of the Week: Week 28, 2014: UK Wage Differences
At the end of last week, the ONS released a report on how wages have changed over time, particularly for three cohorts born in 1954, 1964 and 1974.
Chart of the Week: Week 28, 2014: UK Wage Differences
At the end of last week, the ONS released a report on how wages have changed over time, particularly for three cohorts born in 1954, 1964 and 1974.
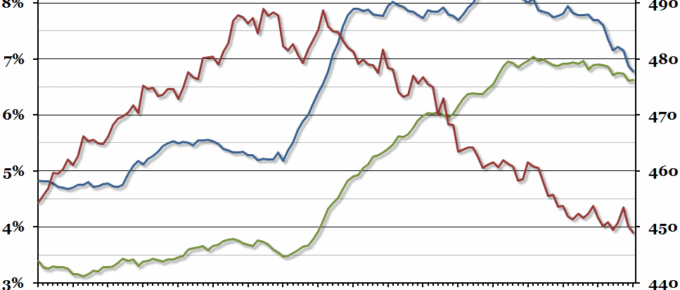
Chart of the Week: Week 20, 2014: UK Labour Market
The official UK unemployment rate continued its sharp decline in the three months to March.
Chart of the Week: Week 13, 2014: Wages vs. Prices
Inflation figures for February were released this week, showing a further fall in the CPI measure to 1.7%.

