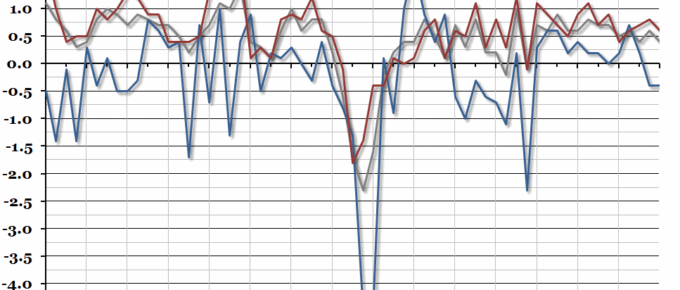
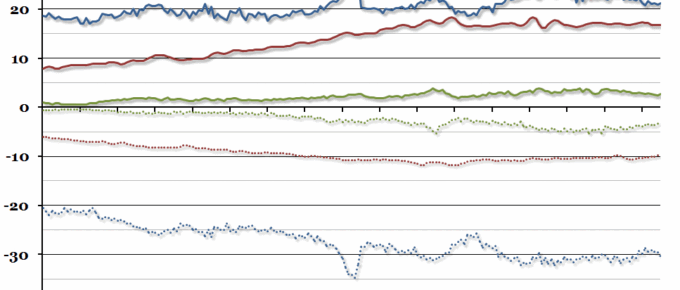
The UK’s trade balance statistics for the first quarter of the year were released yesterday.
Chart of the Week: Week 17, 2016: GDP Growth by Sector
The preliminary estimate of first quarter GDP growth was released this morning, and it showed that growth had slowed at the beginning of this year to 0.4% (from 0.6% at the end of 2015).
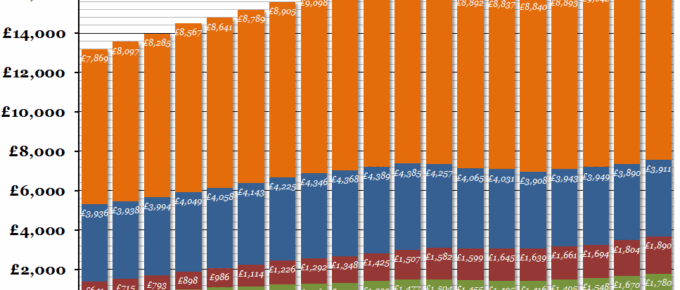
Chart of the Week: Week 14, 2016: UK Household Spending
A large quantity of statistics relating to the final quarter of last year were released at the end of last week, and one interesting aspect was that real per capita household spending in 2015 almost returned to the 2007 peak.
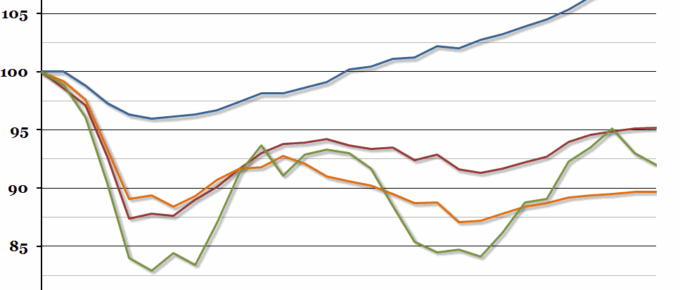
Chart of the Week: Week 22, 2015: UK GDP Growth by Sector
Contrary to most economists’ expectations, the overall growth rate in the first quarter of this year remained unchanged last week, at a disappointing 0.3% (most people had expected it to be revised upwards).
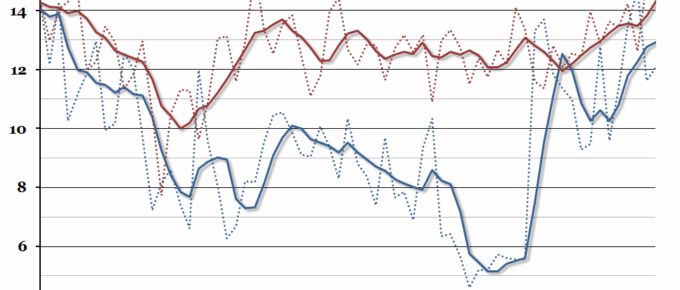
Chart of the Week: Week 47, 2014: Profitability of UK Companies
The non-financial services sector set a new record for profitability in the second quarter of 2014, continuing the strong services recovery since 2011.
Chart of the Week: Week 38, 2014: UK Trade Balance
Last week it was reported that the UK’s balance of trade deficit increased to an estimated £3.3bn in July, compared to £2.4bn the previous month.


